Get in touch with Dreamland Playground Company

Restaurant Unit-Economics Guide
A restaurant playground business model is a store-level profit framework judged by attributable family-party sales, contribution profit, and seat-hour economics, not by a borrowed revenue-uplift percentage. This guide shows how to measure average check, table turnover, displaced seats, operating costs, and payback without confusing family attraction with proven profit.
Scope: this article owns restaurant-specific financial measurement and pilot design. Playground layouts, equipment specifications, hygiene procedures, supplier selection, and quotations remain with their dedicated design, operations, and commercial pages.
Updated August 2026. All worked figures are labeled hypothetical and must be replaced with store data.
Quick answer: the 7 inputs a restaurant playground profit model needs
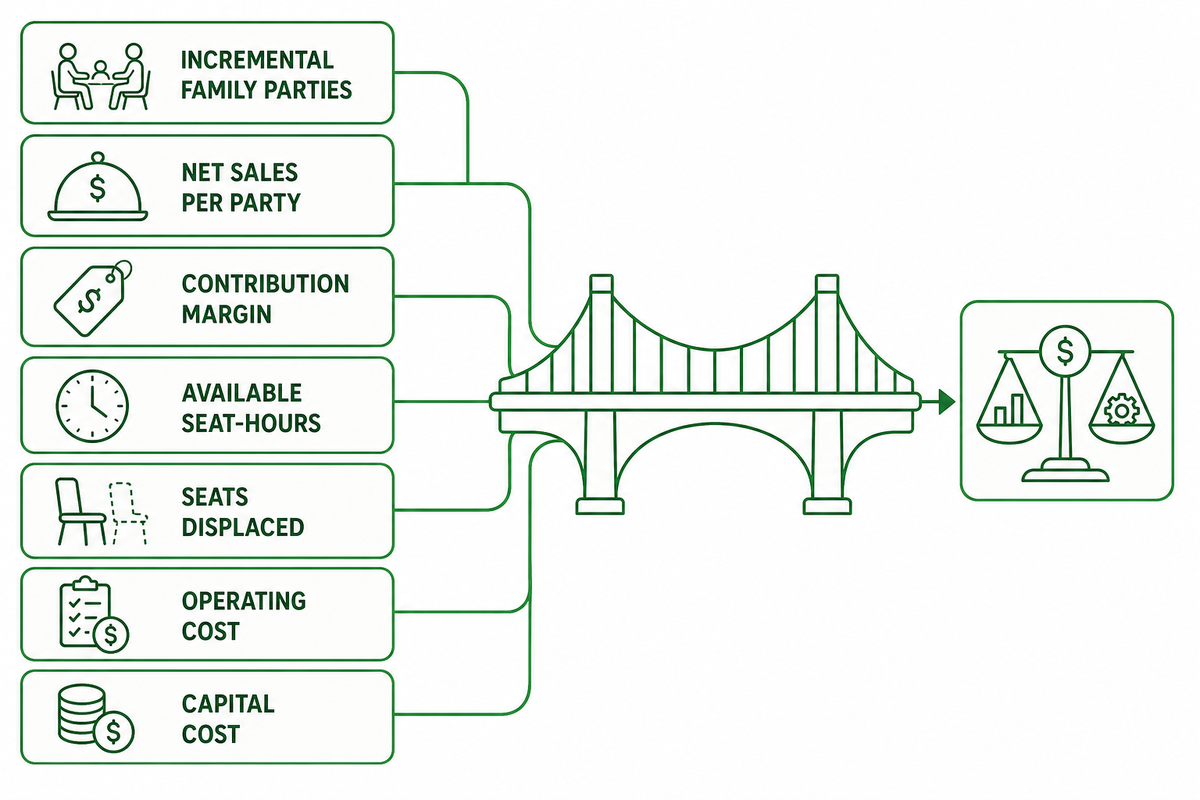
Direct answer: a restaurant playground model needs seven measured inputs: incremental family parties, comparable net sales per party, contribution-margin rate, available seat-hours, seats displaced, incremental operating cost, and capital cost. Without all seven, a sales story can’t show whether the play area creates restaurant profit. Because every worked figure below must be replaced with store data, these inputs turn the no-borrowed-uplift rule into a store-level test.
The 7-Input Playground Profit Bridge
This 7-Input Playground Profit Bridge is a store-level worksheet that converts attributable family demand into contribution profit after capacity, operating, and capital effects.
The framework uses Cornell restaurant revenue-management research to keep revenue, time, and capacity in one decision system rather than treating a higher check as sufficient proof.
| Input | Definition | Primary record | Failure boundary |
|---|---|---|---|
| Incremental family parties | Parties that would not otherwise have visited | POS family flag plus comparison | Do not count shifted dayparts twice |
| Net sales per party | Comparable sales after discounts and exclusions | POS party check | Control for party size and prices |
| Contribution margin | Sales left after variable costs | Store P&L or recipe costing | Do not substitute gross margin blindly |
| Available seat-hours | Available seats multiplied by period hours | Floor and trading schedule | Separate peak and off-peak periods |
| Seats displaced | Dining capacity removed by the play zone | Approved plan and count | Include applicable accessible circulation |
| Incremental operating cost | New fixed and variable cash costs | Ledger by owner and frequency | Include inspection and disruption |
| Capital cost | Project cash required to open | Approved project budget | Do not omit enabling works or contingency |
This bridge is intentionally stricter than “more families came in.” Play can attract visits yet lower profit if it removes constrained seats, lengthens a wait-listed peak, or adds costs that the POS doesn’t show beside the related sales.
Key takeaway
Financial value appears only when attributable contribution exceeds incremental operating cost and the opportunity cost of constrained restaurant capacity.
Are restaurant play areas actually profitable?
Some can be profitable, but the reviewed evidence doesn’t supply a universal restaurant-playground uplift or payback range. Restaurant-choice research supports the idea that play facilities can influence family preference; it doesn’t prove that the resulting visits are incremental, that party checks rise, or that contribution covers lost seats and new costs. Profitability must therefore be calculated at the store and daypart level.
Validate the market, then choose restaurant-led, play-led, or hybrid
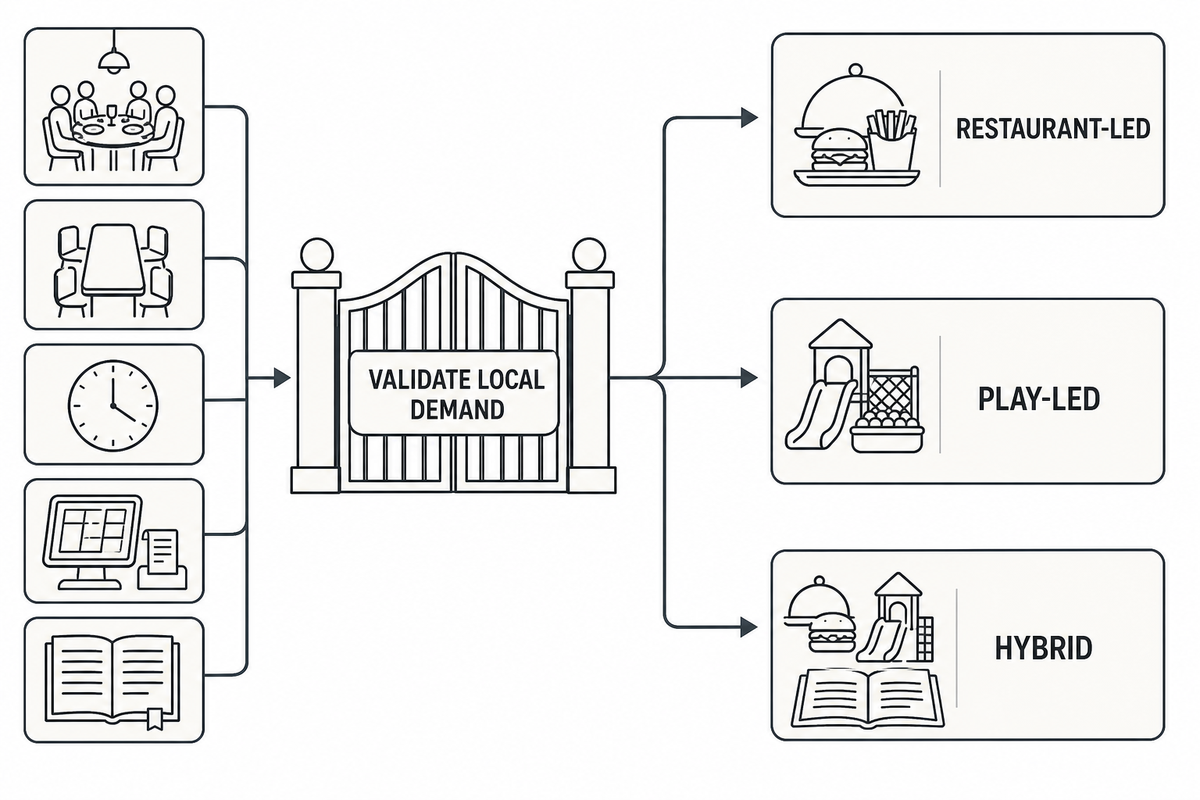
Direct answer: validate local family demand, market size, location, saturation, and price tolerance before selecting the revenue model. Restaurant-led concepts monetize food first, play-led concepts monetize access first, and hybrids require separate ledgers so one engine doesn’t conceal losses in the other.
Following the U.S. Small Business Administration market-research framework places demand, market size, location, saturation, and competitor pricing at the outset. That sequence matters: naming a concept “hybrid” doesn’t validate whether nearby families want it or will pay enough to support its space and labor.
| Decision factor | Restaurant-led | Play-led | Hybrid |
|---|---|---|---|
| Primary payer | Dining party | Child admission or membership | Dining and play customers |
| Core unit | Party check | Paid visit | Separate units by stream |
| Main capacity | Seats and kitchen | Play capacity and sessions | Whichever constrains first |
| Access rule | Usually tied to purchase | Usually paid or timed | Explicit cross-credit needed |
| Party revenue | Food-led package | Room and play package | Split food, room, and play |
| Peak risk | Long dwell blocks tables | Session or staffing bottleneck | Two queues conflict |
| Best proof | Party contribution plus RevPASH | Contribution per session | Stream-level contribution |
| Data warning | Do not treat play as free | Do not assign all café sales to play | Do not combine denominators |
| Not suitable for | A venue whose demand depends on admission | A conventional restaurant unwilling to manage recreation | A POS and team unable to separate streams |
Keep neighboring concepts in their own model
An indoor playground, play cafe, or family entertainment venue may earn most of its money from admission, memberships, birthday parties, or open play. Restaurants with a free soft play area earn through food first, so the business plan must price seats, kitchen capacity, and party checks rather than assume indoor playground economics.
The same boundary applies to indoor playground equipment. Installing a ball pit, slide, or larger play structure changes inspection, cleaning, supervision, and space inputs, but this guide doesn’t rank play equipment or an equipment supplier. Restaurant business owners should validate whether the concept can attract customers profitably before purchasing equipment.
Intent boundary map: adjacent searches this guide does not own
The phrases below occur in the mixed search field, but they describe startup, venue, experience, or procurement decisions. Grouping them here keeps this profit guide useful to restaurant owners without turning it into a competing play-cafe plan or equipment page.
| Adjacent query cluster | Terms users may encounter | Why it remains separate |
|---|---|---|
| Startup | starting a play cafe; opening a play cafe; starting an indoor playground; starting an indoor playground business; new business; business venture; business license | These require entity, funding, permitting, and launch guidance rather than a store-level intervention test. |
| Owner profile | cafe owners; play cafe owners; current play cafe owners; small businesses; business experience; a play cafe’s operating questions | Operator identity does not establish incremental restaurant demand. |
| Venue format | indoor playground business; play cafe business; indoor play cafe; indoor playground or play cafe; coffee shop; indoor playground industry; type of business | Each format needs its own payer, capacity, and revenue denominator. |
| Facility identity | commercial playground; commercial indoor playground; dedicated indoor playground; outdoor playground; colorful indoor playground; perfect playground; reputable indoor playground; play destination | Venue labels do not prove restaurant profit or define a transferable benchmark. |
| Guest experience | children play; active play; exclusive play; play experience; customer experience; target audience; customer base; play environment; part of the community | These are demand hypotheses to test, not financial outcomes to assume. |
| Play operations | staff member; supervised play; play needs; play elements; types of indoor play; indoor play structures; adding a play area; soft play area | They belong in staffing, risk, capacity, and cost inputs after local review. |
| Offers and revenue | food and drink; cafe items; cafe sales; play passes; open play; host birthday parties; revenue stream; repeat visits; profitable business; profitable play | Each stream must be tagged separately before contribution is assigned. |
| Procurement and layout | equipment supplier; indoor playground equipment supplier; purchasing equipment; cafe equipment; floor plan | Specification, supplier selection, configuration, and quotation intent remain on commercial pages. |
Census Bureau product-statistics guidance distinguishes immediate-consumption food from other restaurant products such as party-space rental. Use the same discipline locally: record food, play access, party room, membership, and retail sales separately. For a broader paid-admission indoor playground, use the mall FEC revenue-stream model instead of importing its economics into a restaurant or cafe.
Start with the counterfactual: which visits and sales are truly incremental?
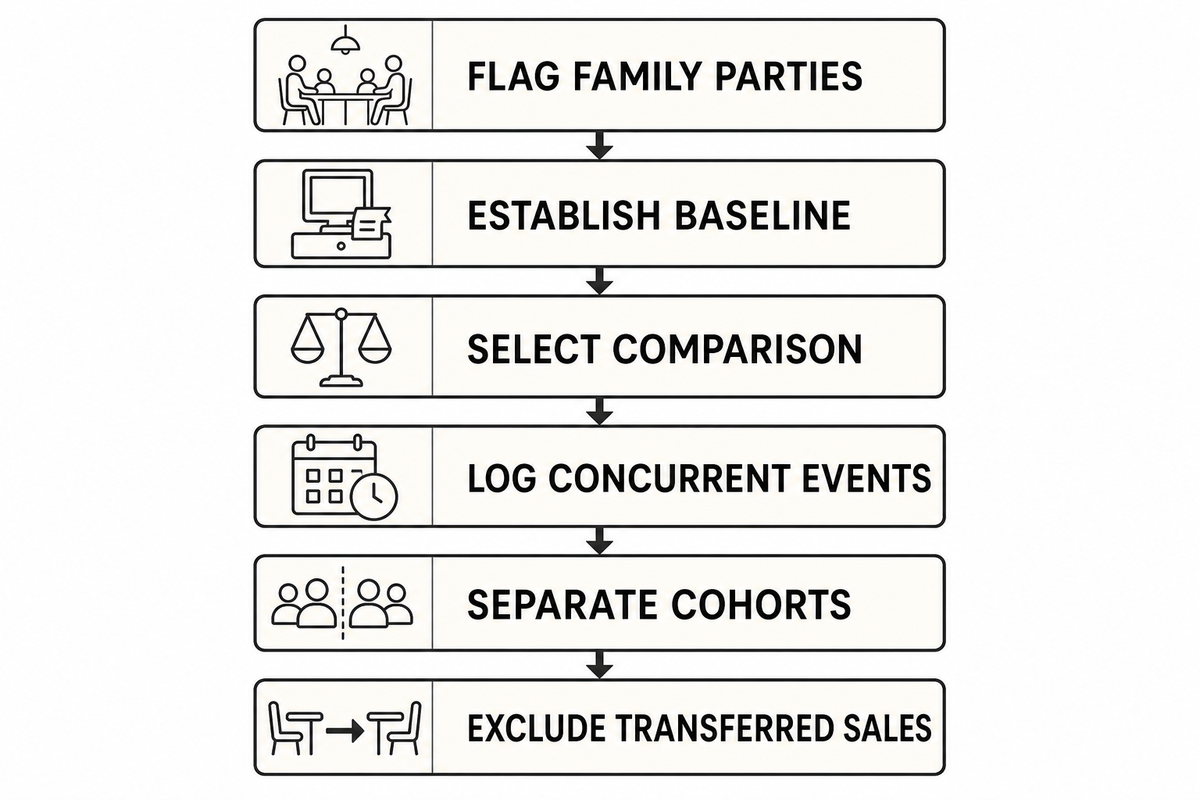
Direct answer: attributable sales are the sales that would probably not have occurred without the play area. Separate new family parties, shifted visits, repeat visits, and existing customers; then compare them with a credible baseline or control while recording promotions, prices, weather, holidays, and competing events.
The restaurant-choice research indexed by the Journal of Tourism Sciences supports a bounded claim: perceptions of playground entertainment and safety can affect restaurant choice. It doesn’t show how many visits are incremental or how much profit results.
Use an attribution waterfall
- Flag family parties — define the POS or host signal before data collection begins.
- Establish the baseline — preserve comparable dayparts and enough prior history to see normal variation.
- Select a comparison — use an unaffected store, matched daypart, or credible synthetic comparison when feasible.
- Log concurrent events — record promotions, menu prices, weather, holidays, school calendars, roadworks, and nearby events.
- Separate customer cohorts — distinguish first-time attraction from returning family behavior.
- Exclude transferred sales — remove visits shifted from another company store or period when estimating network-level incrementality.
For a single-store operator, a perfect control may not exist. In that case, present the result as a monitored association, not a causal return claim. Multi-unit indoor-playground or restaurant operators can usually do better by selecting a similar store that doesn’t receive the play intervention during the test.
Do
- Predefine the family-party flag
- Compare the same dayparts
- Record price and promotion changes
- Track first and repeat visits separately
Don’t
- Credit all post-opening sales to play
- Compare a holiday with a normal week
- Count transferred visits as network growth
- Call six weeks causal proof
Measure average check without double counting family spending
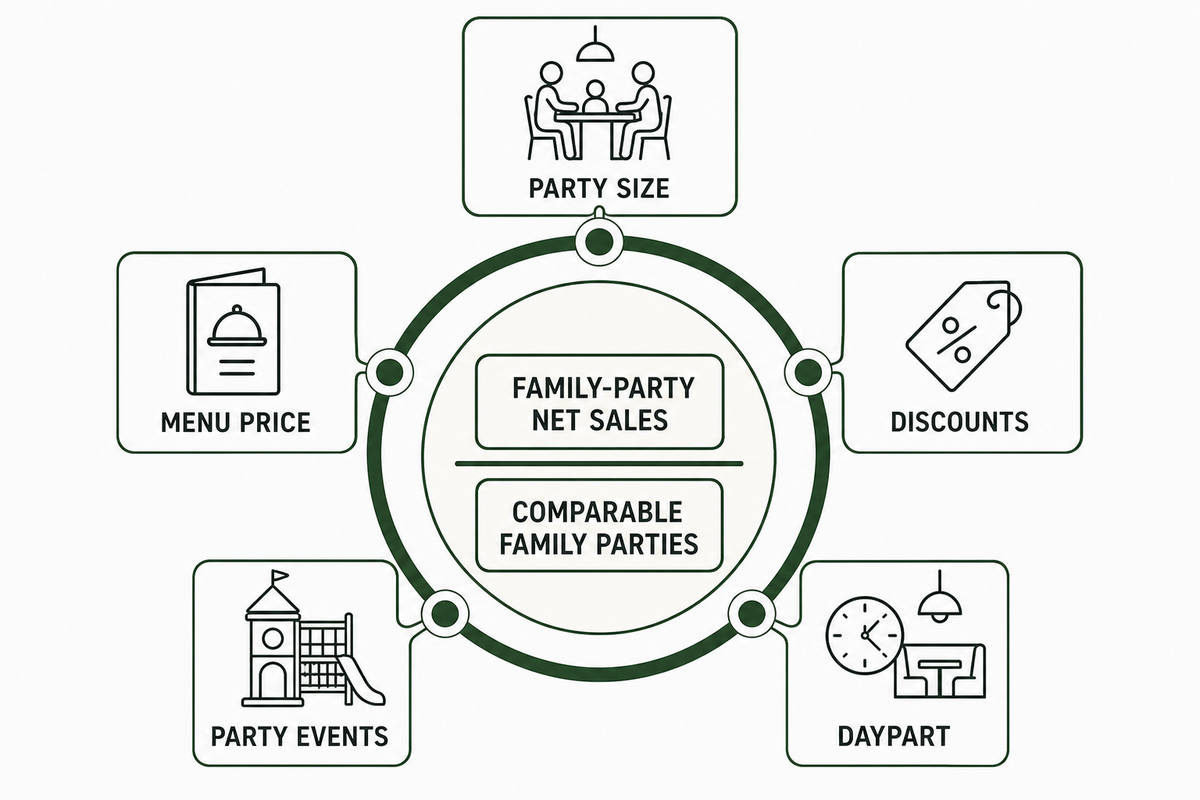
Direct answer: family average check equals comparable family-party net sales divided by comparable family parties. Keep the party, not the guest or transaction fragment, as the unit, and control for party size, discounts, taxes, tips, menu-price changes, channel, and party-event mix. Following the counterfactual screen above, exclude sales that would have occurred anyway.
Formula
Comparable family average check = comparable family-party net sales ÷ comparable family parties
The U.S. Census Bureau’s product-statistics framework separates revenue categories; the same discipline keeps food, party-space, and play-related sales from being counted twice in this store model.
Hypothetical example: a baseline produces $7,200 of net sales from 240 comparable family parties, or $30 per party. During the test period, net sales reach $8,580 from 260 parties, or $33. The observed check difference is $3, but it isn’t yet attributable to the play area.
Suppose a menu-price change accounts for $1.20 per party and a birthday-package mix shift accounts for another $0.80. After those adjustments, the remaining association is $1 per party: $33 − $30 − $1.20 − $0.80. That amount still needs a comparison store or period before it can be treated as an intervention effect.
| Check | Why it changes the result | Treatment | Limitation |
|---|---|---|---|
| Party size | Larger families naturally spend more | Stratify or adjust | Host counts may be imperfect |
| Menu price | Raises check without volume | Hold price constant | Mix can still change |
| Discounts | Change net realization | Use net sales | Coupon targeting may differ |
| Tax and tip | Not equivalent to restaurant revenue | Exclude consistently | POS definitions vary |
| Channel | Dine-in differs from delivery | Restrict to comparable channel | Omnichannel parties may overlap |
| Party events | Deposits and packages inflate the mean | Analyze as separate cohort | Small sample can be volatile |
| Daypart | Lunch and dinner checks differ | Compare matched periods | Traffic mix can shift |
| New versus repeat | Novelty can change first checks | Track cohorts | Identity matching needs consent and care |
| Outliers | One large event can dominate | Report median and distribution | Do not delete valid high checks |
How much more revenue can an indoor play area generate?
No authoritative universal percentage was found in the reviewed evidence. Published vendor and single-operator indoor playground figures lacked a transferable control design, margin detail, or representative sample. Replace those claims with a store-specific counterfactual: incremental family parties multiplied by adjusted net sales per party, followed by contribution, capacity, and cost deductions.
Test table turnover, meal duration, and RevPASH together
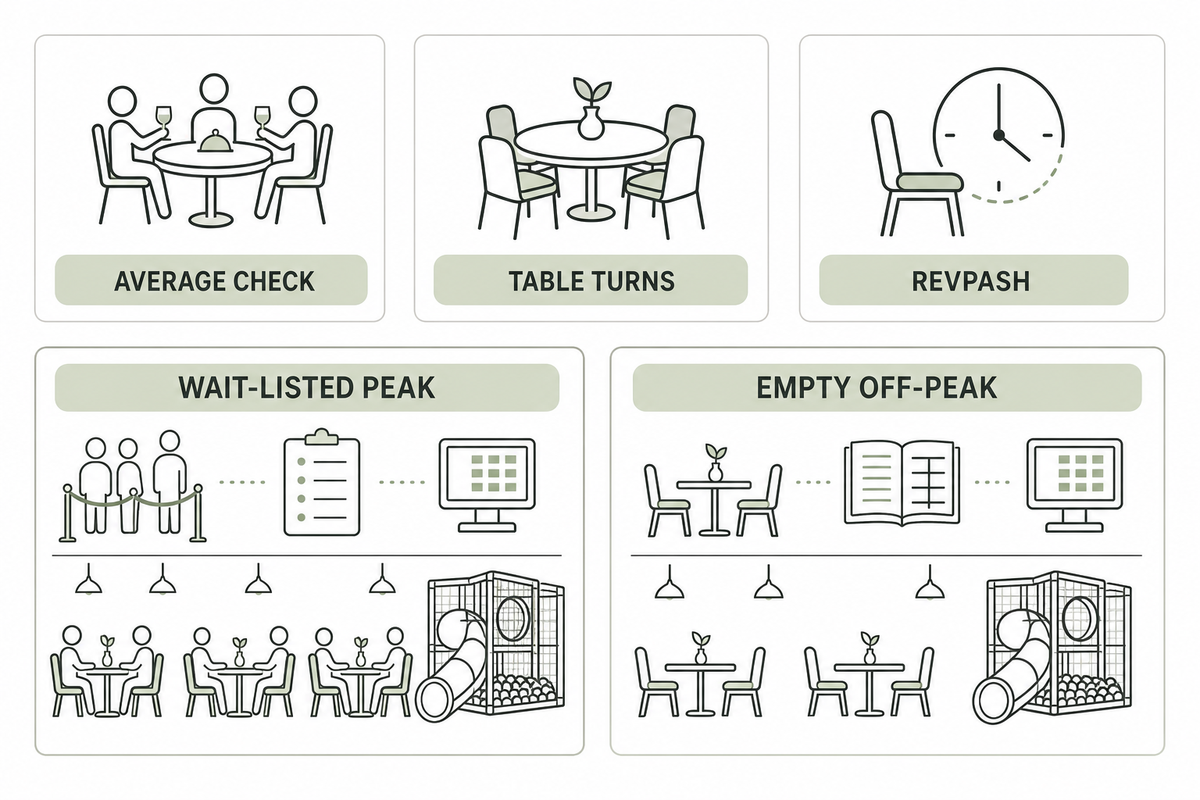
Direct answer: RevPASH equals period net sales divided by available seat-hours. Read it beside meal duration and table turns by daypart because longer family stays can support add-on purchases below capacity yet block the next party during a wait-listed peak.
Cornell restaurant revenue-management research combines revenue, time, and capacity and also warns that using a check-opening timestamp can distort meal-period analysis. Define the period and timing rule before comparing stores.
One published observational study of 300 families and 450 children reported average visits of 53 minutes, with 18 minutes eating; 65% of the observed children used the indoor play area and play time averaged 33 minutes. These figures demonstrate time allocation in one study, not a universal benchmark, revenue effect, or retention result.
Three denominators, three questions
- Average check: net sales per comparable party.
- Table turns: parties served per table in a defined period.
- RevPASH: period net sales per available seat-hour.
Hypothetical peak: an 80-seat dining room over three hours has 240 available seat-hours. Baseline net sales of $2,400 produce RevPASH of $10. After adding an indoor playground area, $2,700 produces $11.25—but that isn’t automatically a success if prices, promotions, or party mix changed.
If average family duration rises from 50 to 65 minutes while the restaurant has a wait list, fewer seat-hours may remain for the next party. At 2 p.m. with empty seats, the same longer stay may have little opportunity cost and could support dessert or beverage sales. The operating answer is conditional on demand relative to capacity.
Will a play area disrupt the dining experience?
Disruption can occur when indoor playground and dining queues compete for the same seating, circulation, staff attention, or checkout process. Segment results by daypart, measure complaints and incidents beside sales, and define where supervising adults sit. A higher check isn’t a full answer if kitchen flow, accessible circulation, or perceived comfort worsens.
Price the seats and floor area the play zone replaces
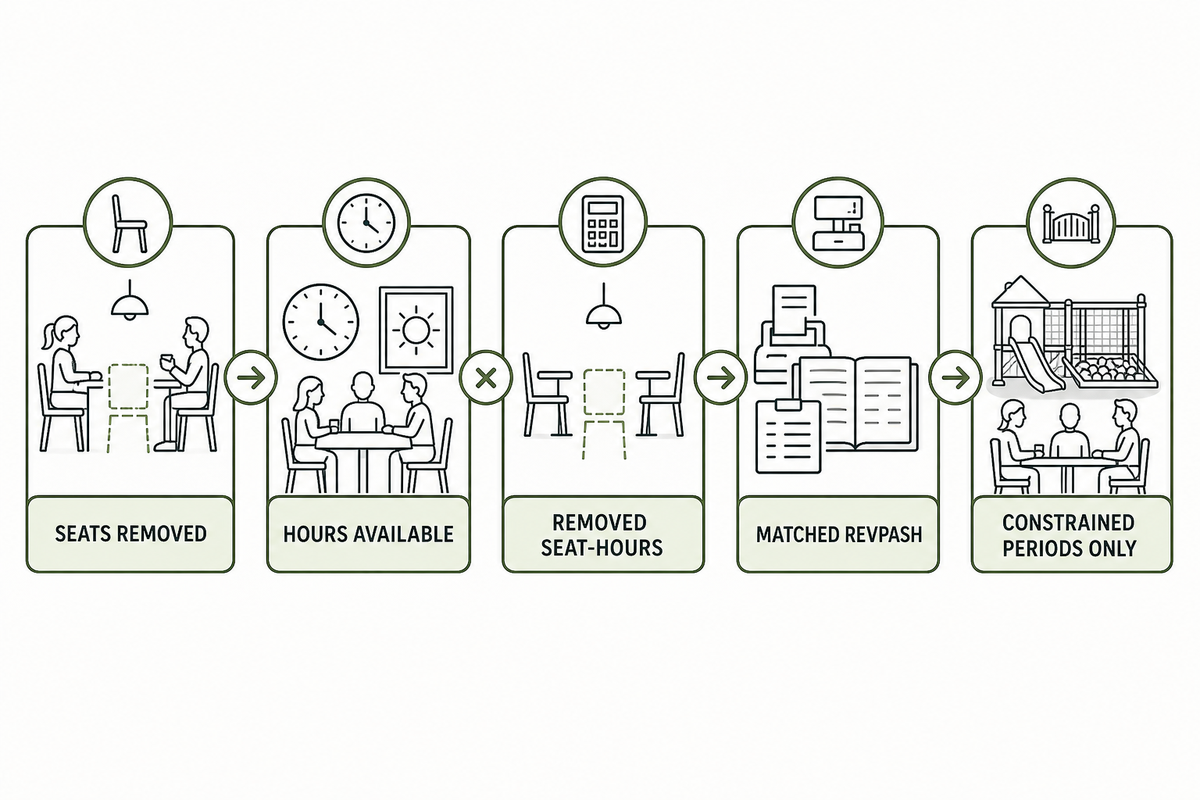
Direct answer: estimate displaced capacity as removed dining seats multiplied by the hours they would have been available, then value those seat-hours with a matched daypart RevPASH only when demand could have used them. Empty off-peak seats don’t carry the same opportunity cost as constrained peak seats.
Hypothetical example: a play zone removes 12 seats during a three-hour dinner period, equal to 36 available seat-hours. At a baseline dinner RevPASH of $10, the upper-bound displaced revenue capacity is $360 for that period. Apply it only to periods where demand is sufficient; otherwise it overstates the loss.
Nominal play-zone square footage isn’t the only space input. The U.S. Department of Justice guidance on the 2010 ADA Standards addresses accessible routes to play components and soft-contained structures and highlights recurring surface maintenance. Applicability varies, so confirm the site with the authority having jurisdiction and qualified accessibility professionals.
Space worksheet
- Count approved dining seats removed.
- Map the exact dayparts when they would be available.
- Calculate removed seat-hours.
- Apply matched RevPASH only during demand-constrained periods.
- Add enabling-space effects such as circulation, supervision sightlines, queuing, storage, and applicable accessible routes.
- Keep fire, occupancy, accessibility, and design approval outside the financial spreadsheet until qualified reviewers confirm them.
For a mall-oriented capacity exercise, the mall play-area space planner owns the adjacent space-planning intent. This restaurant guide stops at financial inputs and doesn’t prescribe a floor plan.
Build a decision-ready incremental cost ledger
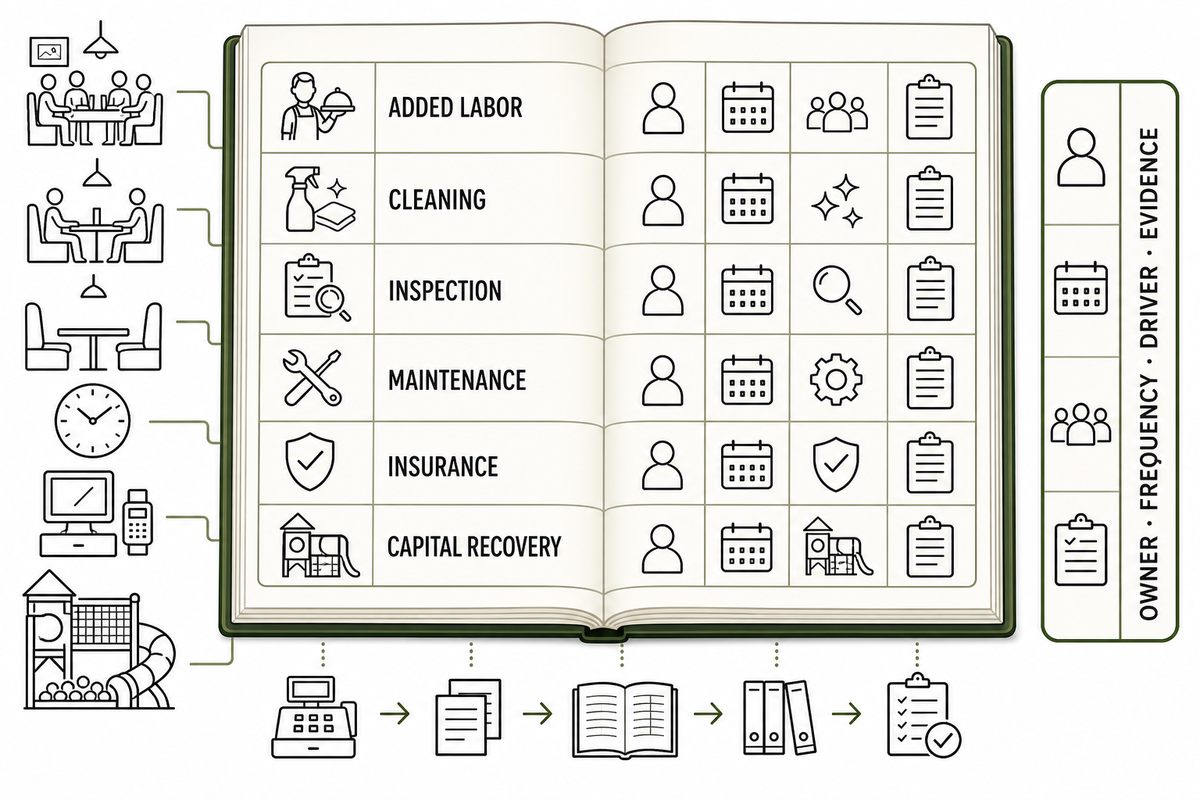
Direct answer: a decision-ready ledger records every cost created by the play decision, its owner, frequency, driver, and evidence. For clear auditability, include labor, training, cleaning, inspection, maintenance, accessibility upkeep, supervision, records, repairs, insurance, utilities, consumables, disruption, and capital recovery. The displaced-seat capacity calculation above belongs here as an opportunity cost, not as a second sales deduction.
In its 2024 cost analysis, the National Restaurant Association reported full-service labor-cost medians of 36.5% overall, 34.2% among profitable respondents, and 42.9% among loss-making respondents. Those figures are context, not targets for a specific restaurant or play area.
Define supervision before calculating labor. A parent-supervised play amenity isn’t operationally equivalent to staff-provided care or custody. California licensing guidance, for example, says that care and supervision of nonrelative children from multiple families will likely require a child-care license. Confirm the operating model with the competent local authority before opening; signage alone doesn’t settle that classification.
| Cost line | Driver | Owner | Evidence | Limitation |
|---|---|---|---|---|
| Added labor | Hours and wage burden | Operations | Schedule and payroll | Shared staff still consume time |
| Training | Initial and refresher hours | Operations/HR | Training records | Requirements vary |
| Cleaning | Frequency, time, supplies | Operations | Logs and invoices | No universal interval assumed |
| Inspection | Scope and frequency | Safety/facilities | Reports and closeouts | Site rules control |
| Maintenance | Planned tasks and parts | Facilities | Work orders | Asset mix changes cost |
| Accessible surfaces/routes | Material, use, upkeep | Facilities | Review and maintenance record | Confirm applicability locally |
| Supervision | Operating rule and staffing | Operations | Roster and incident review | Not replaced by signage |
| Insurance | Coverage and risk review | Finance/risk | Binder and broker advice | Premium effects are site-specific |
| Repairs | Failures and part life | Facilities | Repair history | New sites lack history |
| Utilities/consumables | Use and unit cost | Finance/facilities | Meter or purchase record | Allocation can be approximate |
| Disruption | Closure and lost operation | Operations/risk | Incident and downtime log | Probability is uncertain |
| Capital recovery | Approved cost and horizon | Finance | Project ledger | Simple payback ignores financing |
Call it “decision-ready,” not “complete.” Insurance terms, permits, accessibility, inspection scope, supervision expectations, and emergency access depend on the site, operator, equipment, insurer, and jurisdiction. A spreadsheet can’t replace those reviews.
Calculate incremental contribution profit and payback
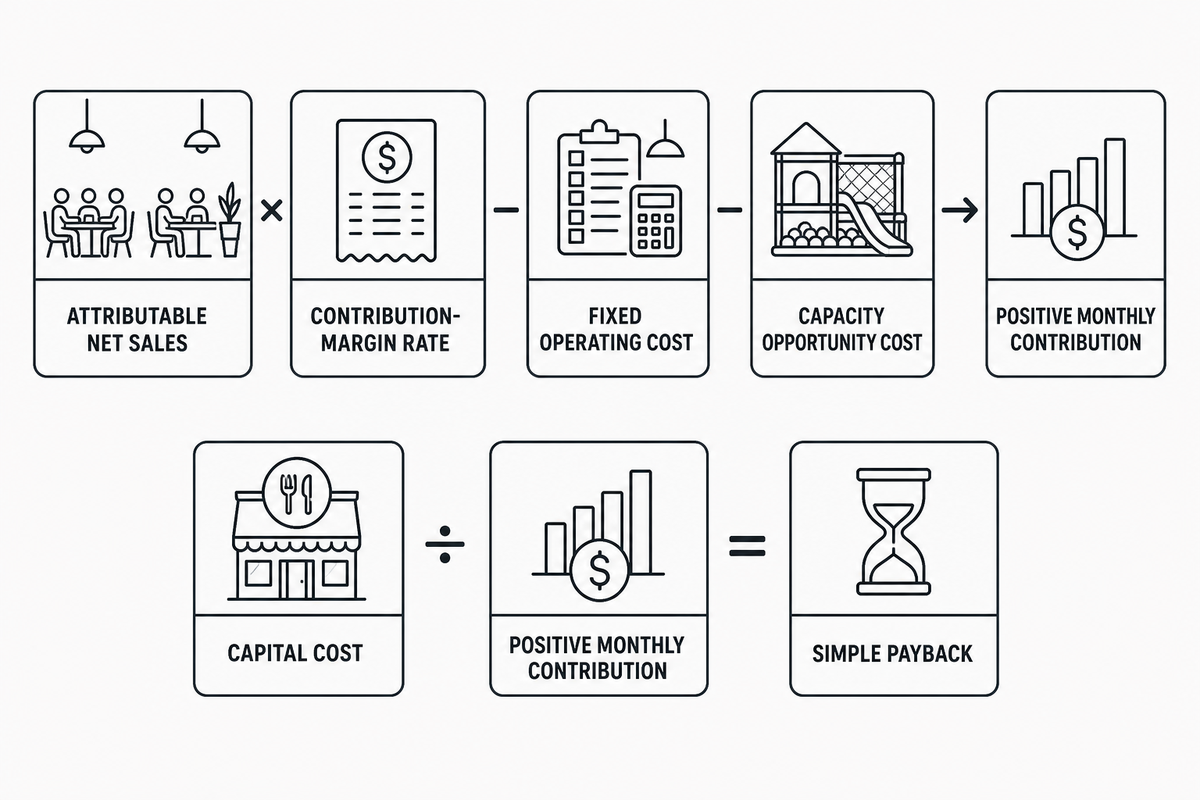
Direct answer: incremental contribution profit equals attributable net sales multiplied by the contribution-margin rate, minus incremental fixed operating cost and capacity opportunity cost. Simple payback divides capital cost by positive monthly incremental contribution profit and is invalid when the denominator is zero or negative. With the decision-ready operating ledger assigned, its lines become the deductions in this contribution bridge.
Core equations
Incremental contribution profit = attributable net sales × contribution-margin rate − incremental fixed operating cost − constrained-capacity cost
Simple payback months = capital cost ÷ positive monthly incremental contribution profit
Five-year decision horizon — hypothetical operator inputs:
| Cost item | No rollout | Play rollout |
|---|---|---|
| Purchase price | $0 | $60,000 |
| Installation & commissioning | $0 | $12,000 |
| Energy (5-yr) | $0 incremental | $3,000 |
| Maintenance & spares (5-yr) | $0 incremental | $18,000 |
| Downtime risk (5-yr) | $0 incremental | Operator scenario input |
Hypothetical payback: if attributable monthly net sales are $12,000, the store contribution-margin rate is 65%, incremental fixed operating cost is $4,200, and constrained-capacity cost is $600, monthly incremental contribution is $12,000 × 0.65 − $4,200 − $600 = $3,000. With $72,000 of purchase plus installation cost, simple payback is $72,000 ÷ $3,000 = 24 months. This is an illustration, not Dreamland performance data or a forecast.
This example becomes useful only after every input is replaced and reconciled with the store P&L. If the same sales would have occurred without the play area, attributable sales fall. If the play zone blocks a constrained dinner peak, capacity cost rises. If play changes the sales mix, use the actual contribution margin of that mix rather than a storewide shortcut.
Run downside, base, and upside scenarios
| Driver | Downside | Base | Upside | Decision use |
|---|---|---|---|---|
| Attributable monthly sales | $7,000 | $12,000 | $16,000 | Replace with comparison estimate |
| Contribution margin | 60% | 65% | 68% | Use actual incremental mix |
| Fixed operating cost | $4,800 | $4,200 | $3,900 | Bind to ledger owners |
| Capacity cost | $1,000 | $600 | $200 | Use constrained dayparts only |
| Monthly contribution | −$1,600 | $3,000 | $6,780 | Negative case has no payback |
| Simple payback | Not meaningful | 24 months | About 10.6 months | Illustrative only |
Don’t average the scenarios into a single “expected” result unless the probabilities are defensible. The more useful question is which uncertain input changes the decision. If incrementality drives the reversal, invest in a better comparison; if capacity cost drives it, test a different schedule or footprint before buying. Standalone mall concepts belong in the separate shopping-mall kids-zone break-even framework.
Use a 6-week pilot window for a go, modify, or stop decision
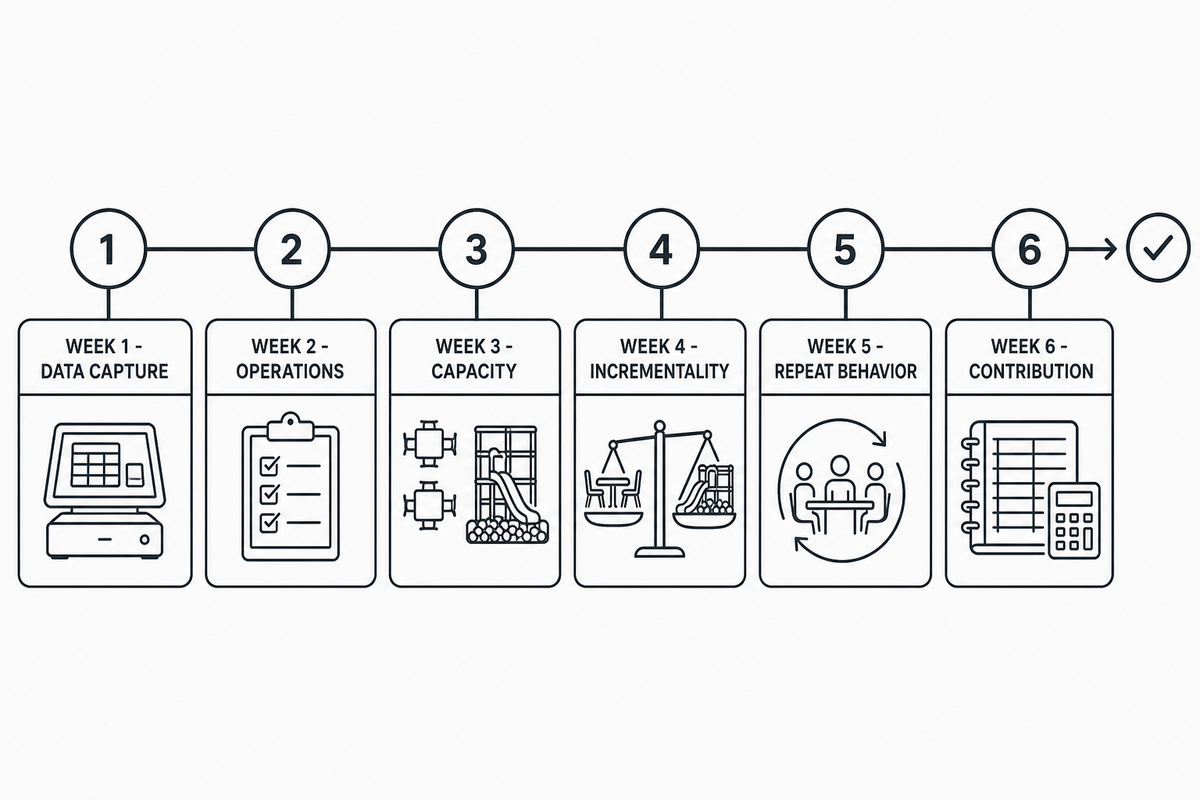
Direct answer: six weeks can be a practical operating observation window, but it isn’t independent causal proof. Predefine a prior baseline, matched control where feasible, family-party flag, capacity metric, cost ledger, concurrent-event log, first-versus-repeat cohorts, and decision rule before the test begins.
The 6-Week Go-Modify-Stop Pilot Window
The 6-Week Go-Modify-Stop Pilot Window is a precommitted operating test that links family demand, capacity, cost, incidents, and customer cohorts to a bounded decision without claiming that short-term association proves long-term ROI.
A methods paper in the International Journal of Epidemiology explains that a basic interrupted time series can’t exclude co-interventions or other events near the intervention. An appropriate control series can reduce history bias, but the control itself must be selected carefully.
| Window | Primary task | Required evidence | Do not conclude |
|---|---|---|---|
| Before week 1 | Freeze definitions and decision rules | Prior baseline, control plan, event log | That the baseline is permanently stable |
| Week 1 | Validate data capture | Party flags, checks, timestamps, costs | That opening curiosity will persist |
| Week 2 | Check operations | Queues, complaints, incidents, labor | That sales alone show success |
| Week 3 | Review capacity by daypart | Duration, turns, RevPASH, wait list | That one daypart represents the store |
| Week 4 | Audit incrementality | Control differences and concurrent events | That correlation proves causation |
| Week 5 | Test repeat behavior | First and returning family cohorts | That first visits equal retention |
| Week 6 | Reconcile contribution | Sales, variable cost, fixed cost, capacity | That six weeks settles seasonality |
| Decision | Go, modify, stop, or extend | Precommitted thresholds and exceptions | That extension guarantees proof |
| After the window | Monitor durability | Longer trend and repeat cohorts | That novelty is durable demand |
Decision rules to precommit
- Go: attributable contribution is positive, constrained-period capacity remains within the approved threshold, operational safeguards pass, and the result isn’t explained by a major concurrent event.
- Modify: one controllable driver fails, such as access rules, schedule, footprint, staffing, data capture, or party packaging.
- Stop: contribution stays negative under verified inputs, safety or accessibility conditions can’t be resolved, or disruption exceeds the accepted limit.
- Extend: the sample is too sparse, seasonal, or confounded to support the planned decision.
Before a full rollout, route the project into an implementation control such as the play-zone handover checklist. The financial result doesn’t replace installation, acceptance, accessibility, insurance, or operating approval.
What changes in 2026: margin pressure raises the evidence bar
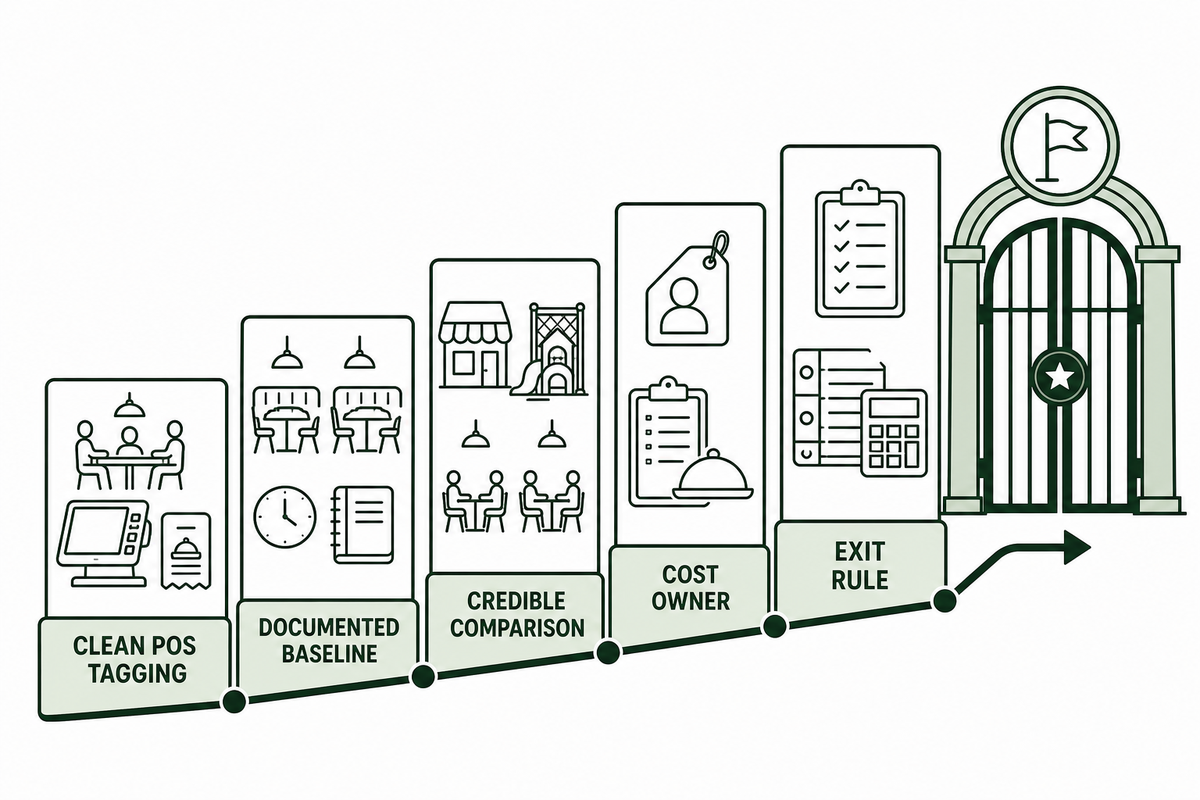
Direct answer: 2026 combines renewed restaurant interest in family experiences with continuing cost and traffic pressure. That makes playgrounds strategically relevant, but it also makes unsupported uplift claims less acceptable: operators need attributable contribution, capacity, and operating-risk evidence before committing capital. The pilot result above is therefore an evidence threshold for separating early signals from durable return, not a substitute for installation or operating approval.
The National Restaurant Association’s 2026 industry outlook projects $1.55 trillion in restaurant sales while describing uneven traffic and continuing cost pressure. That macro forecast is context; it doesn’t predict a play area’s return.
Restaurant Business reported renewed family initiatives and play spaces among named chains in 2026. Khalilah Cooper of Chick-fil-A described the experience goal as a place of connection
; the article didn’t disclose a controlled playground profit result.
Strategic adoption is evidence of operator interest. It is not evidence that every format, footprint, daypart, or market will earn a positive return.
Evidence boundary used in this analysis
A restaurant owner deciding now should demand cleaner POS tagging, a documented baseline, a credible comparison, a cost owner for every new task, and an exit rule. If the economics survive those tests, the next step is to discuss a restaurant play-area project with the operating constraints already defined.
FAQ: Restaurant playground business model
How do you calculate profit from a restaurant playground?
Restaurant-playground profit equals attributable sales contribution minus incremental operating costs, constrained-capacity costs, and the monthly capital-recovery charge used in the decision model for that site.
Start with family-party sales that probably would not have occurred without the play area. Multiply those net sales by the relevant contribution-margin rate, then subtract new fixed operating costs and opportunity cost from displaced seats during constrained periods. Simple payback divides approved capital cost by positive monthly incremental contribution. A zero or negative contribution denominator has no meaningful payback.
Does a kids’ play area increase a restaurant’s average check?
A kids’ play area may coincide with a higher comparable family-party check, but no universal uplift has been verified and price or party mix can explain the change.
Calculate comparable family-party net sales divided by comparable family parties. Then control for party size, menu prices, promotions, discounts, tax and tip treatment, daypart, channel, and party-event mix. Compare the adjusted change with a suitable control store or period. Without those steps, a higher reported check may reflect pricing or mix rather than the play area.
Can longer family visits hurt table turnover?
Longer family visits can reduce peak table turns when a wait list exists, while creating little capacity cost during dayparts when seats would otherwise remain empty.
Measure meal duration, table turns, wait-list conditions, and RevPASH by daypart. A two-hour family stay at a quiet 2 p.m. period has different economics from the same stay during a sold-out dinner. Read add-on sales beside available seat-hours and displaced parties; do not use one universal duration target for every period.
Should the play area charge admission?
Admission should depend on whether food, paid play, or both carry the economics, tested against local willingness to pay, capacity rules, and separate POS reporting.
Validate local willingness to pay and define purchase, time, and capacity rules before testing. Keep admission, food, party, and membership revenue in separate POS ledgers.
What costs belong in a playground ROI model?
A playground ROI model needs every cash, capacity, risk, and capital cost created by the decision, with an assigned owner, frequency, driver, and evidence field.
Include added labor, training, cleaning, inspection, planned maintenance, repairs, applicable accessibility-route and surface upkeep, supervision, recordkeeping, insurance effects, utilities, consumables, incident disruption, displaced-seat capacity, purchase, enabling works, installation, commissioning, spares, and capital recovery. Assign each line an owner, frequency, driver, and evidence field. Requirements and insurance treatment vary by equipment, site, operator, and jurisdiction, so obtain project-specific professional review.
How long should a restaurant run a pilot?
A six-week pilot can reveal operating patterns, but it cannot by itself prove causal or durable ROI; use a baseline, comparison, and longer follow-up period.
Use a prior baseline and matched control where feasible, log concurrent events, and extend the window when traffic is sparse, seasonal, or confounded. Continue monitoring repeat-family behavior after the opening effect fades.
What data should a multi-unit operator compare?
Multi-unit operators should compare matched intervention and control stores using identical metric definitions, cohort rules, dayparts, and records for concurrent promotions or local event changes.
Compare family-party count, first and repeat cohorts, adjusted party check, meal duration, table turns, RevPASH, displaced-seat cost, labor, cleaning, maintenance, incidents, complaints, and contribution profit. Record promotions, prices, weather, school calendars, events, and store differences that could explain the result.
References & Sources
- Restaurant Revenue Management and RevPASH Cornell University
- Restaurant Time and Capacity Research Cornell University
- Playground Facilities and Restaurant Choice Study Journal of Tourism Sciences
- Observed Family Time in Fast-Food Restaurants Young Consumers
- Labor Cost and Restaurant Profitability Analysis National Restaurant Association
- 2026 State of the Restaurant Industry National Restaurant Association
- Market Research and Competitive Analysis U.S. Small Business Administration
- Guidance on the 2010 ADA Standards U.S. Department of Justice
- Do I Need a Child Care License? California Department of Social Services
- Controls in Interrupted Time Series Studies International Journal of Epidemiology
- Economic Census Product Statistics U.S. Census Bureau