Get in touch with Dreamland Playground Company

FEC revenue per square foot is the recognized revenue for a fixed period divided by a clearly defined area. Arithmetic is easy; the hard part is deciding which revenue, space, calendar, and venue cohort belong in the comparison.
Bottom line: lock the numerator and denominator before setting a target. Track total leased and guest-facing area side by side, normalize calendar exposure, then diagnose visits, price, throughput, uptime, and margin before changing the attraction mix.
TL;DR
- Use two area views: total leased area for real-estate accountability and guest-facing area for customer-space density.
- Call the result nominal revenue density, not profit or physical productivity.
- Compare venues only after core definitions match and all remaining differences are disclosed.
- Turn a low result into a driver question before turning it into a capital project.
This guide has a different job from Dreamland Playground’s separate commercial benchmark asset. That commercial page owns attraction-type ranges and the supplied benchmark band; this article owns the measurement protocol: how to create a reproducible number, judge comparability, identify what moved, and choose the next investigation.
“Definitions before targets: if finance and operations cannot reproduce both the numerator and the denominator, the ratio is not ready for a benchmark meeting.”
Choose the Area Denominator Before You Calculate
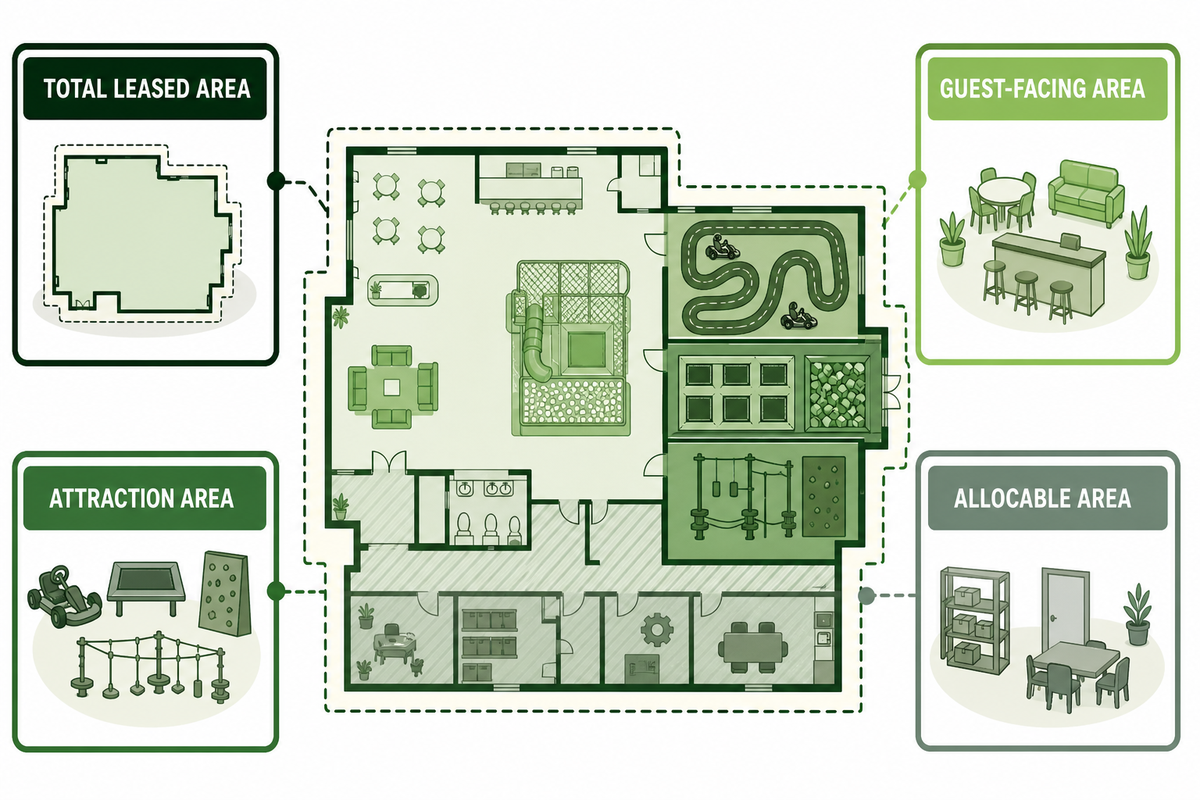
Choose the denominator that fits the decision. Total leased area tests the whole occupancy commitment, while guest-facing area tests the space customers can use. Attraction area can diagnose a zone, and allocable area can bridge shared space. Do not compare two ratios unless their area rules match. A hidden denominator mismatch can create a material reporting risk because even a 10% floor-plan change moves the ratio while revenue stays flat.
The 2-Denominator Rule
Definition: Report revenue against total leased area and guest-facing area together, using one dated floor plan and one exclusion schedule.
| Area denominator | Best decision use | Include | Do not infer |
|---|---|---|---|
| Total leased area | Lease, format, and whole-venue accountability | All area inside the contracted premises | That back-of-house space is waste |
| Guest-facing area | Customer-space revenue density | Attractions, circulation, seating, party rooms, and guest service areas under a fixed policy | Attraction-only earning power |
| Attraction area | Zone diagnosis | Measured attraction footprint plus any consistently assigned queue or operating envelope | Whole-venue economics |
| Allocable area | Shared-space bridge | A documented share of common space | Accounting precision when the allocation rule is arbitrary |
Keep an area register with the drawing date, unit, exclusions, and approver. Renovation work can change the ratio even when revenue is flat, so record both the old and new denominator and the effective date. If the layout is still being tested, the mall play-area space planner can separate guest, attraction, and support-space assumptions before the metric is frozen.
Do: reconcile the area schedule to a current floor plan and keep square feet as the reporting unit.
Do not: remove circulation, seating, toilets, storage, or staff space merely to make the result look stronger. These areas may support capacity, safety, or service even when they do not collect direct revenue.
Do not: remove circulation, seating, toilets, storage, or staff space merely to make the result look stronger. These areas may support capacity, safety, or service even when they do not collect direct revenue.
Occupancy economics sit outside this ratio. Rent structure, common-area charges, and landlord obligations can change a project decision without changing revenue density. Use the mall playground lease negotiation guide when the denominator is part of a lease discussion.
Build a Repeatable FEC Revenue-per-Square-Foot Calculation
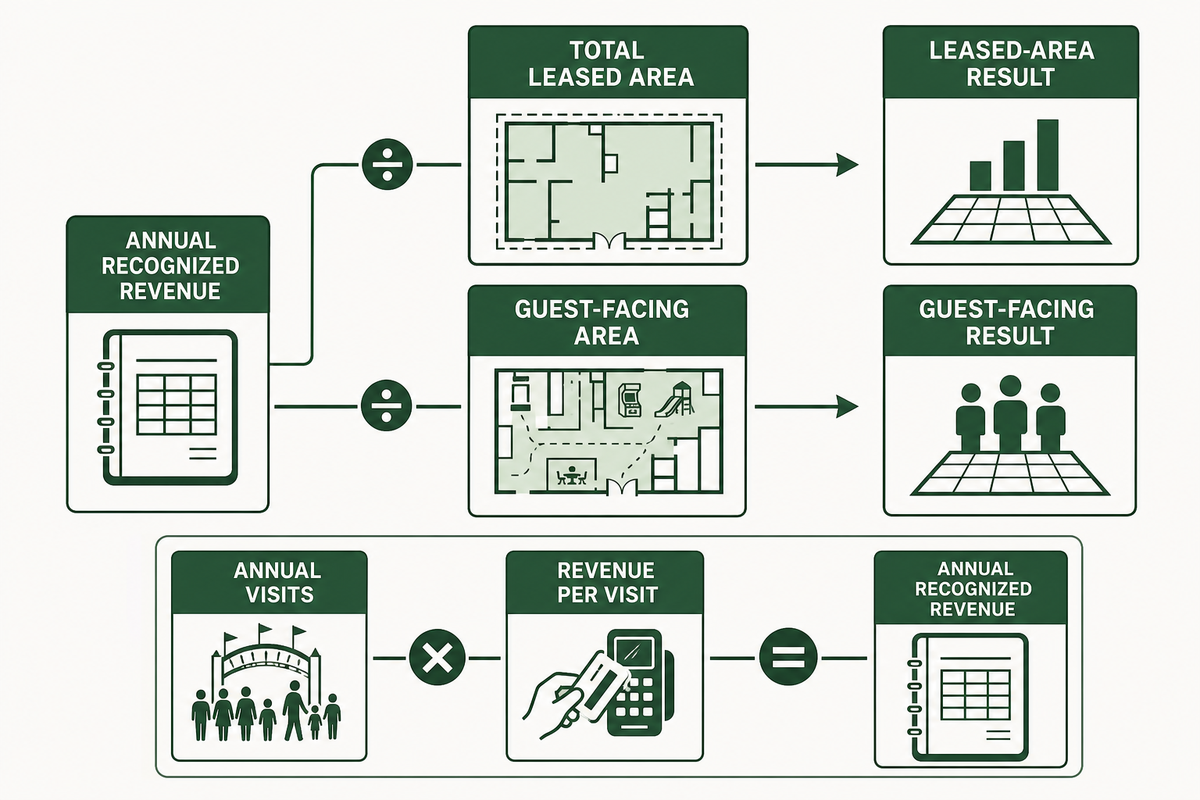
Calculate the metric from recognized revenue, a declared area, and a fixed period. This result shows nominal revenue concentration in space; it does not prove profit, physical output, demand, or attraction quality. Repeatable calculations expose every inclusion, exclusion, conversion, and allocation needed to reproduce the result next month. For an operator or financial buyer, using the wrong period can create a reporting mistake that changes a $1.8 million example by more than 10% without any operating improvement.
FEC revenue per square foot = recognized revenue for the period ÷ declared square feet
One university business-formula reference defines sales per square foot as annual sales divided by retail space and cautions that a “good” number depends on context. That sets the right boundary: the arithmetic is universal, but the management meaning isn’t. See the Eastern Connecticut State University formula reference.
Five-step calculation method
- Fix the period. State the dates, fiscal weeks, closures, and whether the result is actual or adjusted.
- Freeze recognized revenue. Tie the numerator to the ledger and list excluded taxes, deposits, and unrecognized stored-value cash.
- Freeze both area fields. Record total leased and guest-facing square feet from the same floor-plan version.
- Calculate both views. Keep units and rounding consistent; do not average ratios from unequal periods.
- Reconcile and sign off. Finance owns revenue scope; operations owns area and operating-calendar facts.
Illustrative calculation, not an industry benchmark
| Input or result | Illustrative value | What it demonstrates |
|---|---|---|
| Annual recognized revenue | $1,800,000 | Ledger-bound numerator |
| Total leased area | 12,000 sq ft | Whole occupancy commitment |
| Guest-facing area | 9,000 sq ft | Customer-space denominator |
| Leased-area result | $150/sq ft | $1,800,000 ÷ 12,000 |
| Guest-facing result | $200/sq ft | $1,800,000 ÷ 9,000 |
| Annual visits | 120,000 | 10 visits per leased sq ft |
| Revenue per visit | $15 | 10 × $15 reproduces $150/sq ft |
Important: Every number in this example is synthetic. It demonstrates denominator sensitivity and driver decomposition; it isn’t a Dreamland result, market average, forecast, or target.
This example also shows why the ratio shouldn’t be called physical productivity without qualification. If visits stay at 120,000 and revenue per visit rises from $15 to $16.50 because of price or mix, leased-area density rises from $150 to $165. No additional guests or attraction throughput necessarily followed. For that reason, the Bureau of Labor Statistics productivity methodology distinguishes real output from nominal value.
| The ratio can help with | The ratio cannot prove by itself | Required companion metric |
|---|---|---|
| Tracking nominal revenue concentration | More physical activity | Visits, plays, sessions, or completed experiences |
| Testing format and occupancy assumptions | Profitability | Contribution margin and occupancy cost |
| Finding possible underused zones | Causation | Traffic, conversion, throughput, and uptime |
| Comparing defined cohorts | Universal attraction quality | Guest outcomes, strategic role, and matched operating context |
Normalize Revenue Before Comparing Periods
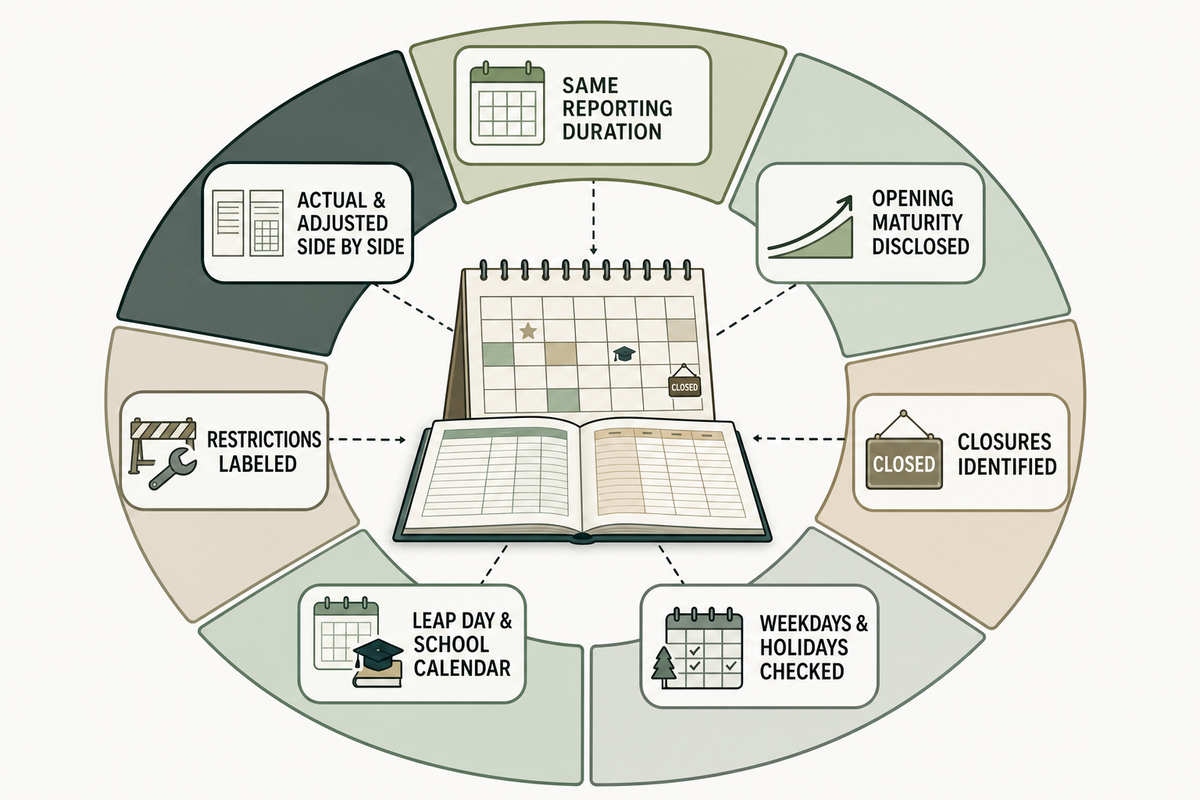
Two periods are comparable only when their operating exposure and maturity are understood. Record openings, closures, construction, operating weeks, weekday mix, moving holidays, leap-year effects, and recurring seasonality. Label the result actual, adjusted, or excluded; never let a mechanical annualization masquerade as observed full-year performance. The comparison risk is structural because an official calendar method can separate a 1-year operating shift from a genuine demand change.
One current public-company filing offers a useful boundary: Dave & Buster’s defines its comparable-store base using stores open for at least 18 months and describes a new-store “honeymoon” effect. This is one operator’s method, not an FEC rule. Read the May 2026 SEC filing for its exact scope.
Comparable-period checklist
- Same reporting duration and fiscal-week count
- Opening maturity and post-opening ramp disclosed
- Full and partial closures separately identified
- Weekday composition and moving holidays checked
- Leap day and school-calendar differences noted
- Renovation, capacity restrictions, and unusual weather labeled
- Actual and adjusted results shown side by side
U.S. Census Bureau time-series references document why weekday composition and moving holidays can distort sales-flow comparisons. Multiplying a 26-week result by two therefore creates a run-rate illustration, not a seasonally adjusted forecast. Retain the observed result and show every adjustment as a bridge.
Cross-year comparisons need a price-level bridge too. Show the reported nominal result, choose a price index that fits the declared geography and revenue scope, state the base year, and present the constant-dollar result beside it. The U.S. Census Bureau constant-dollar guidance explains price-index adjustment; its specific index choices concern income series, not an FEC benchmark or one index for every venue.
Add time exposure to the diagnostic view: open hours, guest-facing hours, and capacity-hours where data quality allows. Two locations can have the same square footage and operating weeks but different daily schedules. Revenue per open hour and visits per open hour help reveal whether the gap comes from time exposure rather than space.
Split the Result by Revenue Stream and Zone
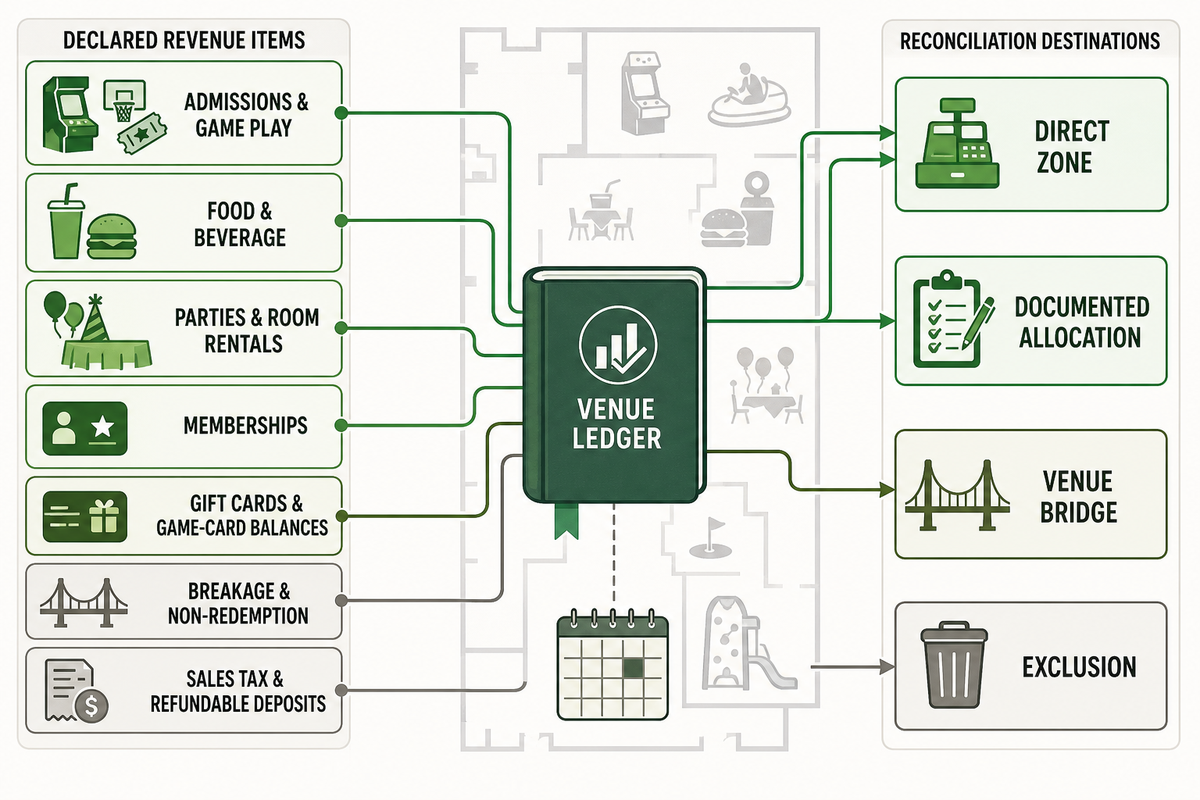
Zone analysis is useful only when all assigned revenue reconciles once to the venue ledger. Define direct revenue, shared revenue, deferred value, and non-zone adjustments before comparing attractions. If a stream cannot be tied to a zone under a stable rule, keep it in a venue-level bridge instead of forcing precision. For an operator or financial buyer, a forced 5% allocation creates a reconciliation gap and hidden double-counting risk because the official filing does not identify which zone earned that value.
Dave & Buster’s fiscal-2025 filing separately reports entertainment and food-and-beverage revenue and describes other revenue that includes party rentals plus gift-card and game-card breakage. It also explains revenue recognition for stored value. The filing is a public-operator example, not an industry numerator standard. See the 2025 Form 10-K.
| Revenue item | Venue numerator treatment | Zone treatment | Control |
|---|---|---|---|
| Admissions, game play, or timed sessions | Include when recognized in the period | Direct when the attraction identifier is reliable | Reconcile to point-of-sale and ledger totals |
| Food and beverage | Include under a consistent venue policy | Keep direct to food service unless a disclosed allocation is needed | Do not assign it to the nearest attraction by convenience |
| Parties and room rentals | Include recognized revenue | Split only with a documented package or time rule | Prevent double counting across room, play, and food |
| Memberships | Follow the venue’s recognition policy | Allocate only when redemption or usage records support it | Keep cash receipt and recognized revenue distinct |
| Gift cards and game-card balances | Include only when recognized | Assign redeemed activity where traceable | Unredeemed value is not automatically current revenue |
| Breakage or other non-redemption effects | Bridge at venue level under the accounting policy | Do not force into a zone without evidence | Disclose temporal and spatial disconnect |
| Sales tax and refundable deposits | Exclude | Exclude | Keep the numerator consistent across periods |
For a mall-specific stream and capacity model, use the separate mall FEC revenue model. Keeping that intent on its existing page prevents this measurement guide from competing with a project-specific revenue model.
Compare Only Like-for-Like FECs
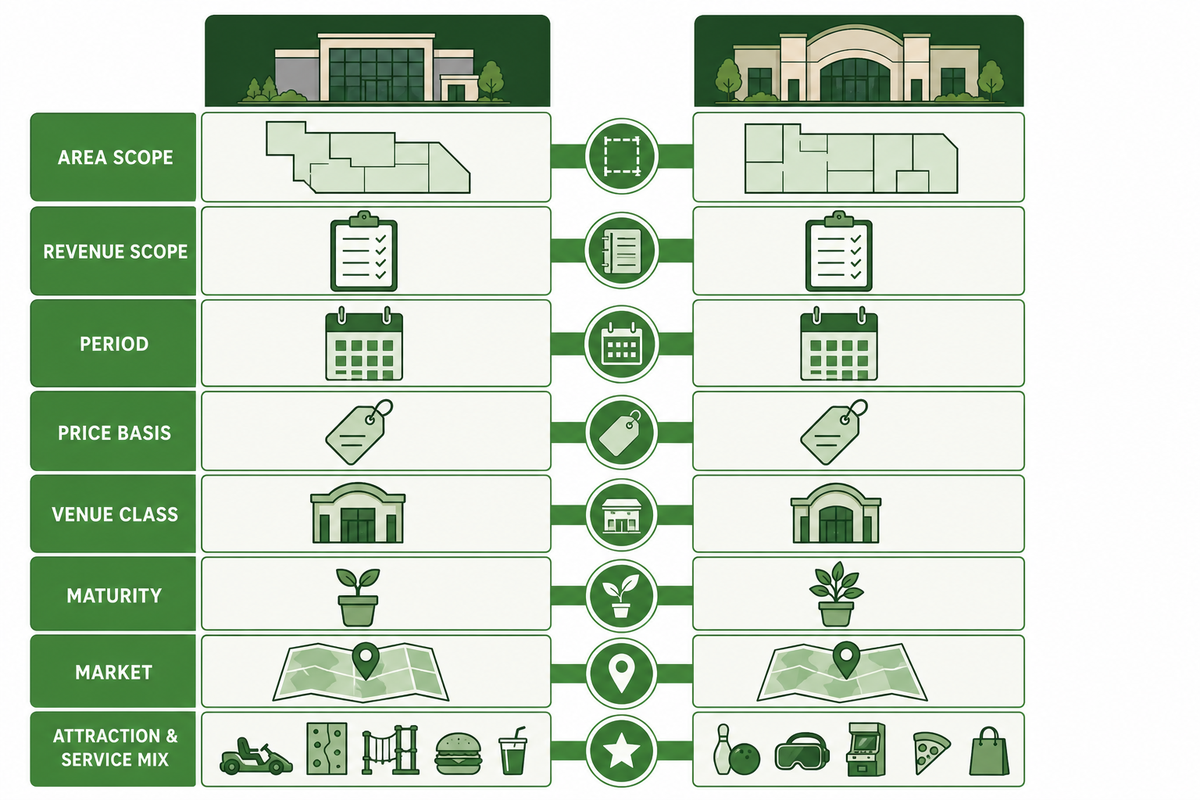
Start by matching core definitions, not by demanding identical venues. Area scope, revenue scope, period, and currency must align. Then segment by format and maturity where possible, disclose region and attraction-mix differences, and treat unmatched comparisons as descriptive signals rather than proof that one venue or concept caused a result.
Region is a comparison control, not an automatic rejection rule. A defensible study can match markets, apply a documented price-level adjustment, or leave the figures unadjusted and disclose the limitation. For U.S. cross-market work, Bureau of Economic Analysis regional price parities provide price-level context by state and metro area; they are not FEC performance targets. Cross-country comparisons must additionally state the currency, conversion date and rate, price-level method, and both unadjusted and adjusted results.
IAAPA’s current entertainment-center benchmark description covers attractions, admissions, staffing, guest behavior, revenue, expenses, and regions. Its public page establishes useful comparison dimensions but doesn’t publish one open universal revenue-per-square-foot target. A 2022 Economic Census classification instrument separately identifies arcades, multi-attraction FECs, children’s party centers, parks, and single attractions such as laser tag or trampoline parks.
For FEC operators, classification is a practical problem. A bowl-and-arcade center, a VR and laser tag venue, an indoor playground with climbing walls, and a multi-attraction hybrid can have different play zones, FEC design constraints, arcade games, staffing needs, and operating costs. Put those differences on the cohort card instead of hiding them inside one average.
Eight-field cohort card
| Field | Required entry | If it does not match |
|---|---|---|
| Area scope | Leased, guest-facing, attraction, or allocable | Recalculate or reject the ratio comparison |
| Revenue scope | Included streams and recognition rules | Build a reconciliation bridge |
| Period | Dates, fiscal weeks, calendar controls | Label as unmatched |
| Price basis | Nominal or constant dollars, index, and base year | Show both; do not treat inflation as operating growth |
| Venue class | Arcade, multi-attraction, party center, or single attraction | Segment before summarizing |
| Maturity | Opening date, renovation, ramp status | Separate new and mature cohorts |
| Market | Region, currency, local calendar, occupancy setting | Match, adjust, or disclose with a defensible method |
| Attraction and service mix | Anchor attractions, arcade, parties, food and beverage | Treat the gap as a likely confounder |
Peer-reviewed matching research warns that exact joint matching across many variables may be infeasible. Use a sensible hierarchy: match the ratio definitions first, segment the largest format and maturity differences, and disclose what remains. Apply weighting or analytical adjustment only when the method and data support it. The Biometrics methodology paper informs this comparison principle, but it does not create an FEC benchmarking standard.
What is a good FEC revenue per square foot?
Good performance means meeting a venue’s contribution, capacity, and strategic goals inside a matched definition. This research found no open universal 2026 target with one declared denominator. Exact-match demand is sparse, while broader searches such as “retail revenue per square foot” and “average revenue per square foot retail” show modest interest. Search volume is editorial context, not evidence that the FEC market or a venue is growing.
Comparison rule: definitions must match; material operating differences must be segmented or disclosed; unmatched data can raise a question but cannot prove a cause.
Diagnose a Low Number with the Revenue Density Driver Tree
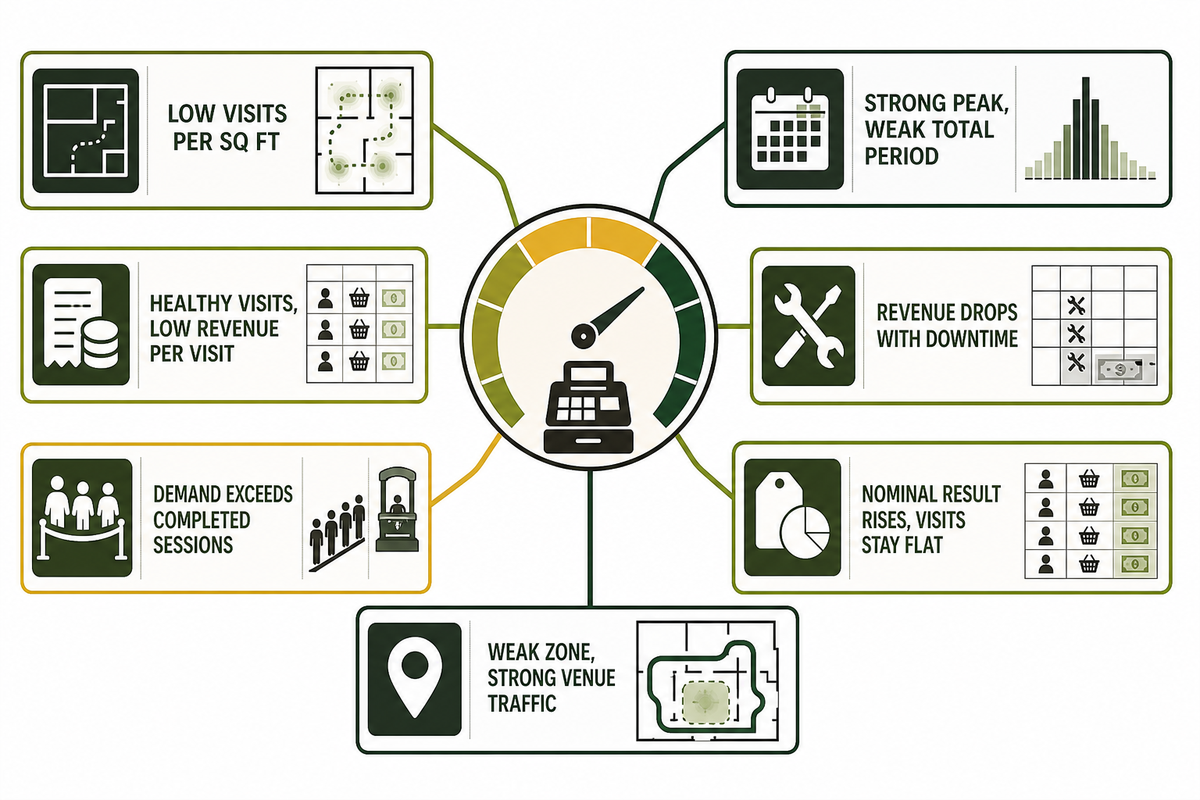
Low revenue density is an outcome, not a diagnosis. Decompose it into visits per square foot and revenue per visit, then test traffic, conversion, price and mix, throughput, operating hours, uptime, and idle area. For an FEC operator, the risk is misdiagnosis because a 10% visit decline can be hidden by price or mix. Investigate the first broken driver before changing price, marketing, staffing, or attractions.
Revenue Density Driver Tree
Definition: A diagnostic map that separates visit density, spend, capacity, uptime, time exposure, mix, and margin before an action is selected.
Revenue ÷ sq ft = (visits ÷ sq ft) × (revenue ÷ visit)
| Observed pattern | First question | Next evidence | Do not assume |
|---|---|---|---|
| Low visits per sq ft | Is demand weak or usable capacity hidden? | Footfall, booking attempts, queue abandonment, operating hours | The attraction itself is unpopular |
| Healthy visits, low revenue per visit | Is conversion, price, package, or mix responsible? | Attach rate, package mix, discounting, redemption | A price increase is automatically safe |
| Demand exceeds completed sessions | Is throughput limiting sales? | Cycle time, reset time, staffing, queue loss | More floor space is the first fix |
| Strong peak, weak total-period result | Are shoulder periods or schedules underused? | Hourly utilization, school calendar, event schedule | Peak capacity represents daily capacity use |
| Revenue drops with downtime | Is uptime or maintenance response the bottleneck? | Downtime log, lost sessions, parts and response time | Marketing caused the decline |
| Nominal result rises, visits stay flat | Did price or mix move? | Price index, product mix, visits, plays | Physical productivity improved |
| Zone appears weak but venue traffic benefits | Is there a halo or anchor role? | Pathing, party bookings, dwell time, attach behavior | Direct zone revenue captures all value |
Suppose the illustrative venue remains at $150 per leased square foot, but visits fall 10% while revenue per visit rises 11.1%. The headline ratio is flat, yet the operating story changed materially. The driver tree flags a demand loss masked by price or mix. It organizes the investigation; it doesn’t prove why visits fell.
For a new project, use the play-area zone mix planner to document proposed roles before comparing future zones with mature operating zones.
Choose the Next Move with the 4-Lens Space Action Matrix
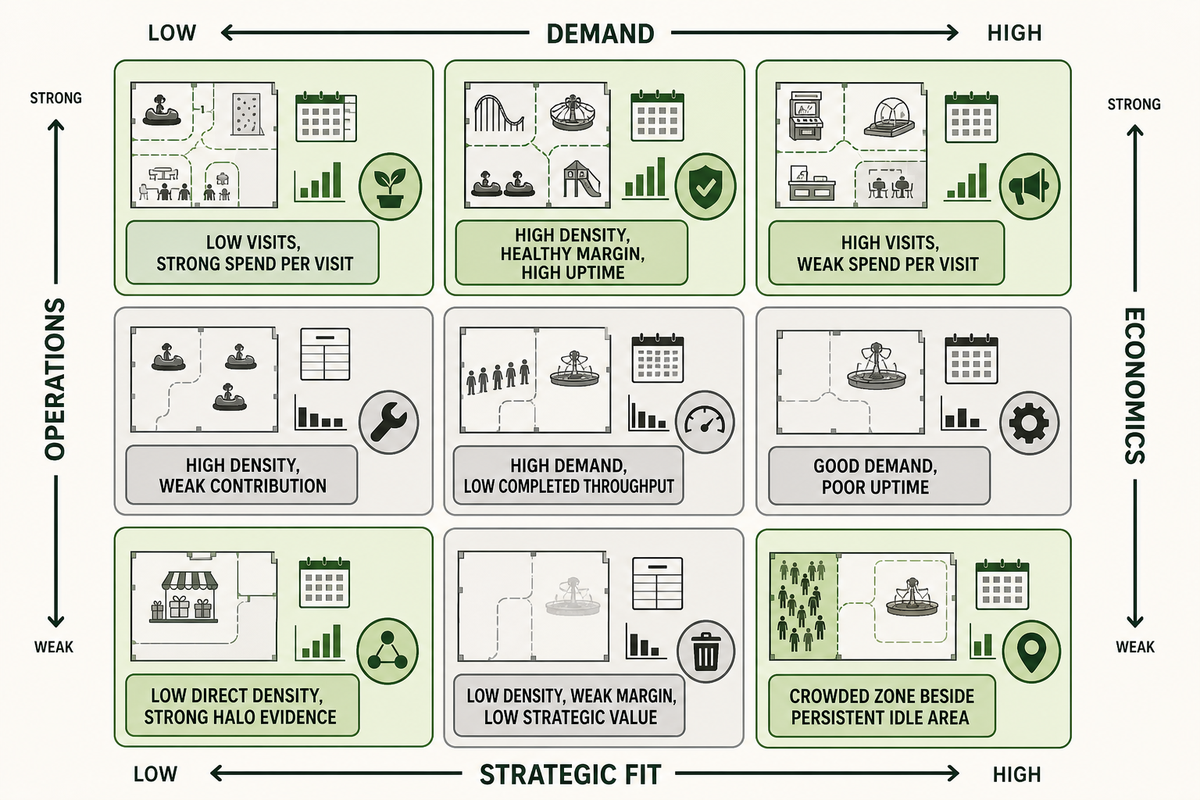
An action is decision-ready only when demand, operations, economics, and strategic fit point in the same direction. Revenue density begins the review; it does not conclude it. For an operator, choosing from the matrix is an application exercise rather than an automatic verdict. Require evidence for contribution margin, uptime, practical throughput, capital cost, disruption, and the zone’s broader role before keeping, repairing, resizing, moving, or replacing a zone.
4-Lens Space Action Matrix
Definition: A nine-scenario decision table that tests demand, operations, economics, and strategic fit while exposing the evidence and limitation behind each move.
| Scenario type | Evidence needed | Default next move | Limitation |
|---|---|---|---|
| High density, healthy margin, high uptime | Stable cohort and capacity headroom | Keep; test a bounded reinvestment | Past strength does not guarantee added demand |
| High density, weak contribution | Product cost, labor, fees, discounting | Repair economics or reprice | Higher price may reduce visits or mix |
| High demand, low completed throughput | Queue loss, cycle and reset times | Remove the operating bottleneck | Added capacity may move the queue elsewhere |
| Good demand, poor uptime | Failure modes and lost sessions | Repair maintenance, spares, or operating discipline | Do not confuse scheduled downtime with failure |
| Low visits, strong spend per visit | Catchment, awareness, booking funnel | Test demand activation | Acquisition cost may exceed contribution |
| High visits, weak spend per visit | Conversion, package, attachment, price | Test offer or mix changes | Direct revenue may miss an anchor role |
| Low direct density, strong halo evidence | Pathing, parties, dwell, attached sales | Keep or reprogram with a halo score | Correlation does not prove the halo caused sales |
| Low density, weak margin, low strategic value | Replacement demand, capex, downtime | Repurpose or replace after a pilot | A new attraction carries ramp and execution risk |
| Crowded zone beside persistent idle area | Flow, visibility, utilities, relocation cost | Resize or relocate | Area moves can impair circulation or support functions |
Translate the chosen move into project economics with local inputs. The indoor playground break-even model separates fixed-cost coverage from the revenue-density headline, while the mall playground ROI calculator extends the review to capital and return assumptions. No payback claim is credible without local capex, contribution margin, demand, and downtime inputs.
Turn the Metric into a Monthly Operating Scorecard
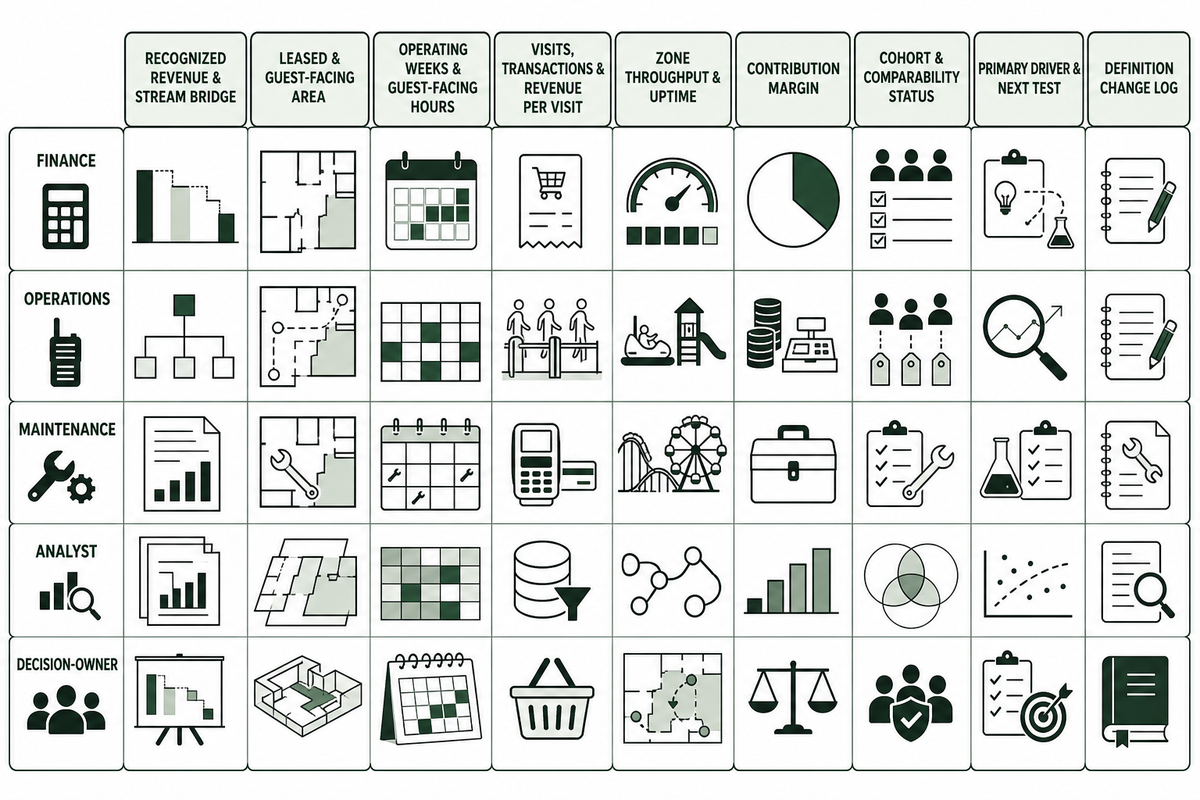
Decision-ready scorecards maintain stable definitions and document what has changed. Identify a finance owner for revenue scope, an operations owner for area, hours, visits, and uptime, and a decision owner for the next test. For an operator, a hidden definition mismatch is a reporting risk because it can make the 7-day and 90-day views tell different stories. Use a trailing view for orientation and shorter spans of time for diagnosis without mistaking noise for trend.
| Scorecard field | Owner | Cadence | Required note |
|---|---|---|---|
| Recognized revenue and stream bridge | Finance | Monthly | Policy or ledger changes |
| Total leased and guest-facing area | Operations / facilities | On change; confirmed monthly | Floor-plan version and effective date |
| Operating weeks and guest-facing hours | Operations | Weekly and monthly | Closures, holidays, restrictions |
| Visits, transactions, and revenue per visit | Operations / finance | Weekly and monthly | Price, discount, and mix movements |
| Zone throughput and uptime | Operations / maintenance | Daily to monthly | Queue loss and downtime reason |
| Contribution margin | Finance | Monthly | Allocation limits and unusual costs |
| Cohort and comparability status | Finance / analyst | Each comparison | Matched, adjusted, or unmatched fields |
| Primary driver and next test | Decision owner | Monthly | Hypothesis, owner, due date |
| Definition change log | Finance / operations | On change | Whether history was restated |
30/60/90-day review cadence
- 30 days-in: confirm data collection and eliminate definition debates.
- 60 days-in: examine driver change, not just the headline ratio.
- 90 days-in: determine whether evidence justifies keep, test, repair, resize, or replace.
Apply a 12-month trailing view for strategic analysis and a weekly or four-week view for operations analysis. A functional dashboard can present 7 days, 28 days, 90 days, and 12 months together, as long as each window is labeled and reconciled. If definitions change, show the old and new series side-by-side. Restate history only when benefits exceed the risk of making a policy change appear to be an operating improvement.
Portable rule: freeze definitions, reconcile the ledger, disclose comparability, diagnose the driver, then choose the smallest test that can change the decision.
Frequently Asked Questions
How do you calculate FEC revenue per square foot?
Use revenue recognized for a fixed period and divide it by a clearly named area denominator. For a whole-venue annual view, calculate annual recognized revenue divided by total leased square feet. Then run a second view using guest-facing square feet. Record operating weeks, closures, exclusions, revenue-recognition rules, and the floor-plan version so another person can reproduce the result. Keep synthetic annualization separate from observed full-year performance.
Is a bigger FEC always more profitable?
No. Larger family entertainment centers can produce more total revenue while lowering revenue density and adding rent, payroll, utilities, maintenance, and capital needs. They may also need more visits merely to cover added fixed costs. Compare contribution margin, practical throughput, uptime, guest experience, and the strategic role of non-revenue space before treating a larger format as a stronger format.
Which attraction has the best revenue per square foot?
There is no universal winner without a defined cohort and allocation policy. Compact arcade zones may show strong direct density but benefit from party or anchor traffic generated elsewhere. Larger attractions may earn less directly while increasing visits, dwell time, or attached sales. Test every option with local throughput, uptime, contribution, labor, demand, area scope, and revenue-allocation assumptions before changing the mix.
Should an FEC use leased area or attraction area?
Use both. Leased area tests the whole real-estate commitment; attraction area tests direct zone density. Match the denominator and exclusions before comparing locations.
Which revenue streams belong in the numerator, and how often should the metric be updated?
Start with revenue recognized in the same period: admissions or game play, parties, food and beverage, memberships, and other earned venue revenue under a documented policy. Exclude sales tax, refundable deposits, and unrecognized stored-value cash. Update a weekly or four-week diagnostic view and a trailing-12-month strategic view each month. Keep breakage and other non-zone recognition in a venue bridge unless evidence supports allocation. At least once every 12 months, confirm the revenue policy against the ledger, remeasure area from the latest approved plan, and record whether any 365-day comparison contains 52 or 53 fiscal weeks.
Build a Project-Specific Measurement Brief
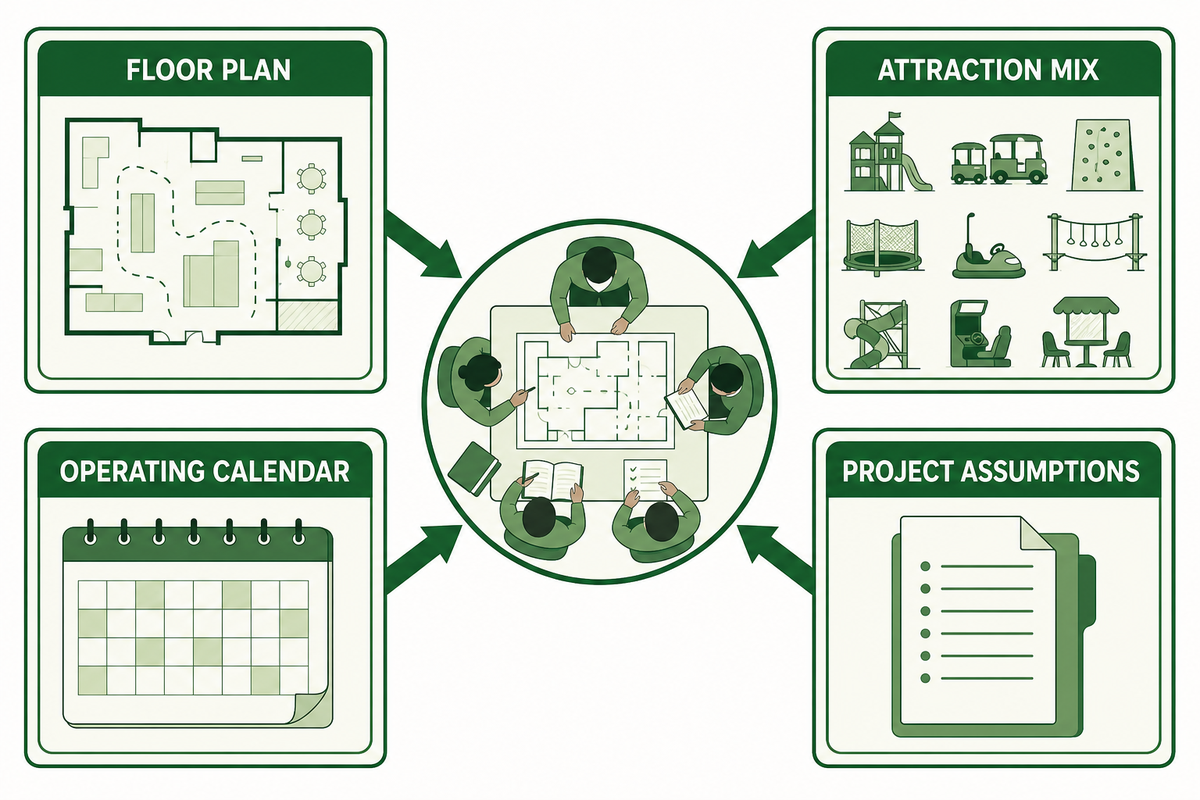
Dreamland Playground can use your floor plan, attraction mix, operating calendar, and project assumptions to structure a planning discussion without turning a public benchmark into a guarantee. Start with the playground business plan builder, or contact Dreamland Playground with the area schedule and decision you need to test.
Related Articles
- Mall FEC Revenue Model
- Mall Playground Lease Guide
- Shopping Mall Kids Zone Business Plan
- Indoor Playground Franchise Guide
References & Sources
- IAAPA: 2025 Entertainment Center Benchmark Series comparison dimensions and calendar-year scope; no public numeric table was reproduced.
- Dave & Buster’s fiscal-2025 Form 10-K one operator’s formats, revenue categories, and recognition policies.
- Dave & Buster’s May 2026 filing one operator’s comparable-store and maturity treatment.
- U.S. Economic Census classification instrument venue and attraction cohort boundaries.
- Eastern Connecticut State University business formulas arithmetic formula and context caution.
- Bureau of Labor Statistics productivity methodology nominal versus real-output boundary.
- U.S. Census time-series references calendar-composition and moving-holiday effects.
- U.S. Census Bureau current-versus-constant-dollar guidance inflation-adjusted comparison method and price-index example.
- Bureau of Economic Analysis regional price parities U.S. state and metro price-level comparison context.
- Biometrics matching-methodology research exact joint matching limitations and balanced comparison logic.
Transparency note: Public association descriptions, government material, university references, and primary company filings support the evidence boundaries in this guide. The named rules, driver tree, matrix, examples, and scorecard are editorial planning tools, not recognized standards, audited forecasts, investment guarantees, or claims about Dreamland’s operating performance.