Get in touch with Dreamland Playground Company

Indoor Playground Profit Margin, Revenue and Payback Data
Yes, indoor playgrounds are profitable. Indoor playground profit margin is owner earnings measured as a share of revenue, and it ran from 19.2% to 56.9% at the venues that disclosed both figures. Across 512 entertainment and recreation businesses sold with full financials disclosed, median owner earnings were $150,000, with half of those owners earned less. Venues that fail and venues that clear half a million dollars buy the same equipment.
We work from your floor plan and site dimensions, and our design team produces the space planning and 3D design.
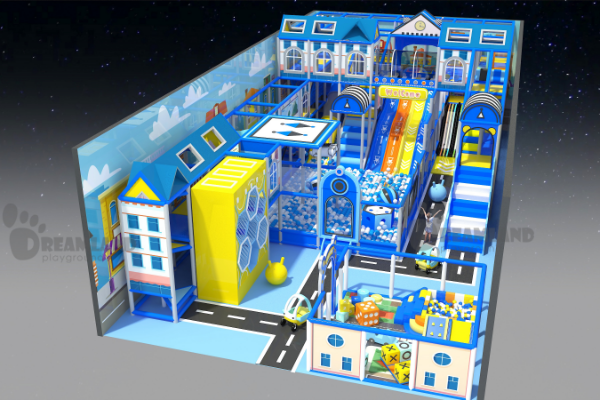
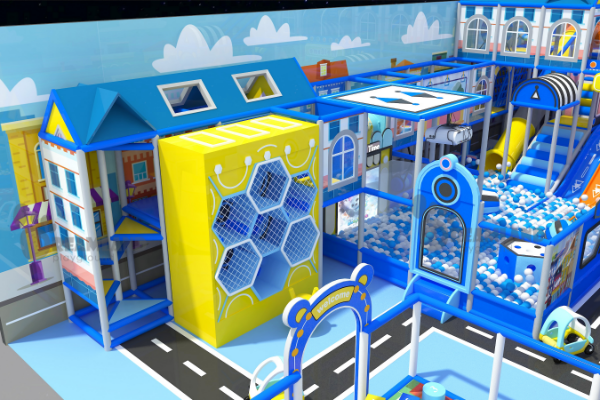
Owner-earnings margin
19.2%, 42.9% and 56.9% at the three venues that disclosed both revenue and earnings.
Median owner earnings
$150,000 across 512 sold businesses. Half of those owners earned less.
Payback, as the market prices it
1.9–3.3 years for venues already trading.
Revenue lines
Six. Admissions is the largest and rarely the most profitable.
Most cited failure cause
Under-capitalisation, then rent and staffing.
Equipment delivery
45–95 days from order confirmation to arrival.
Revenue Benchmarks by Venue Size
Revenue tracks floor area and catchment population more closely than any other variable. A 300 to 500 square metre venue runs $15,000 to $35,000 a month at 10 to 18% owner earnings, while a 1,500 square metre site runs $220,000 or more at 30 to 40%.
| Venue | Monthly visits | Spend per visit | Monthly revenue | Owner-earnings margin | Basis |
|---|---|---|---|---|---|
| 300–500 m² (3,200–5,400 sq ft) | 1,500–3,000 | $8–12 | $15,000–35,000 | 10–18% | Published band with stated assumptions |
| 600–1,200 m² (6,500–12,900 sq ft) | 4,000–8,000 | $14–20 | $60,000–150,000 | 22–30% | Published band with stated assumptions |
| 1,500–3,000+ m² (16,100–32,300+ sq ft) | 10,000–20,000+ | $22–35 | $220,000–600,000+ | 30–40% | Published band with stated assumptions |
| 4,000 sq ft, central Texas | Not disclosed | $10 open play | $26,583 | 42.9% (derived) | Sale listing, established 2023, six staff |
| + Click table to view full market data + | |||||
| Greater Los Angeles | Not disclosed | Not disclosed | $121,909 | 56.9% (derived) | Sale listing |
| California, manager-run franchise | Not disclosed | Not disclosed | $81,909 | 19.2% (derived) | Sale listing |
| Category median, 512 businesses | Not disclosed | Not disclosed | $50,000 (median) | Not comparable | Broker medians. Revenue and owner earnings are separate medians, so dividing one by the other describes no venue |
| Small venue, county of 1.7 million | Around 960 children | $10 open play, $249 per party of up to 40 | Not disclosed | Closed | Former owner, self-reported |
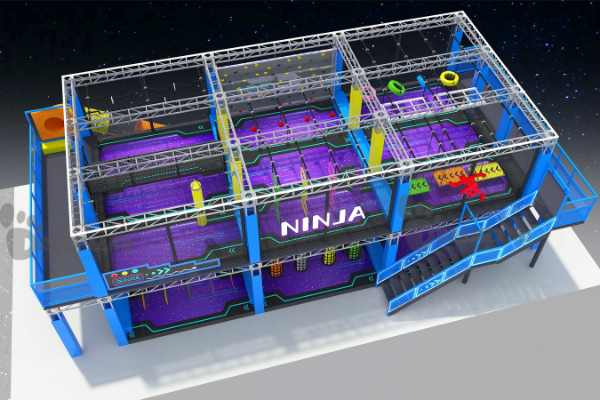
“The same footprint behaves differently by type of indoor playground and by host site. We build for indoor playgrounds, family entertainment centers, trampoline parks, ninja courses, adventure parks, mall play areas, schools, hotels and resorts, and outdoor play.”
The Catchment Test That Comes Before Any Revenue Model
A former owner in a county of 1.7 million people, with 140,000 children under five, averaged 32 children a day. Population is not demand.
01
Start with the population inside a realistic drive time, not the whole city.
02
Keep the share of households with the disposable income to absorb $10–35 per visit.
03
Apply the share of that population aged 0–4, which runs around 7% in most developed markets.
04
Multiply by visits per child per year, which is the number that nearly every plan estimates too high.
Note: That revenue column is monthly venue revenue, not owner income. Owner income is the owner-earnings column, which is what survives rent, payroll, utilities and insurance, and seasonality means no single month sits on the average.
The Six Revenue Streams of an Indoor Playground
Admissions carry 45 to 55% of revenue at the lowest margin of the six lines, while food carries 15 to 25% of revenue at a 60 to 70% gross margin. All six share the same rent, heating and floor staff, so what separates a venue clearing 40% from a venue closing is how much it earns beyond admissions.
Click to Switch
01
Admissions and open play
SHARE OF REVENUE
45–55%
- MARGIN: Covers fixed costs. Capacity-bound and weather-bound
- SCALING: Weekday programming, toddler play sessions, off-peak pricing
- MISTAKE: Modelling weekend footfall across all seven days
02
Food and beverage
SHARE OF REVENUE
15–25%
- MARGIN: 60–70% gross margin on hot drinks and simple food. The highest-margin line in most venues
- SCALING: Seating with sightlines to the play area, so parents stay and spend. A cafe, not a restaurant
- MISTAKE: Bolting the cafe onto the entrance. Seating without Wi-Fi empties by the second hour
03
Birthday parties
SHARE OF REVENUE
10–20%
- MARGIN: $250–600 per booking, scheduled in advance, staffed to a plan (up to 41% of monthly in mid-size)
- SCALING: Dedicated party rooms and tiered birthday party packages, not the open play floor
- MISTAKE: Running parties on the main floor, which caps both lines at once
04
Memberships
SHARE OF REVENUE
8–15%
- MARGIN: Predictable, and only where visit frequency supports it
- SCALING: A catchment where families visit monthly rather than twice a year
- MISTAKE: Selling a membership that is really a discount card
05
Retail
SHARE OF REVENUE
3–8%
- MARGIN: Small, reliable and almost free to add. Grip socks lead it
- SCALING: A mandatory sock policy, simple merchandising, and a till the customer walks past
- MISTAKE: Stocking brand-name toys that compete with what parents already bought
06
Corporate and group hire
SHARE OF REVENUE
5–12%
- MARGIN: Fills the weekday hours that otherwise carry the venue at a loss
- SCALING: Nursery and child care groups, school trips, educational programs, special events, private hire
- MISTAKE: Waiting for these groups to find you instead of selling to them
Profit Margin by Operating Model
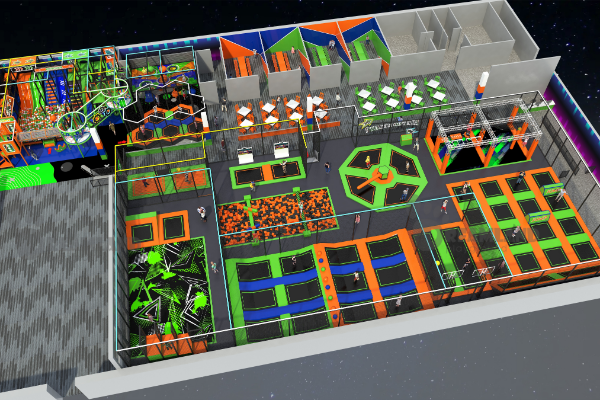
Indoor playground profit margin varies more by operating model than by venue size. The same 600 square metre floor returns different owner earnings according to who carries the operating risk, and the evidence behind each model is uneven, so each row states how strong it is.
Margin by Type of Indoor Playground Business
Operating model
What the owner does
Effect on margin
Strength of evidence
Owner-operated independent
Works the floor, schedules staff, runs the cafe and the party diary
Highest owner earnings, because the owner’s own labour is inside the number
Two disclosed venues at 42.9% [2] and 56.9% [3], both derived from stated revenue and earnings
Manager-run or absentee
Employs a manager and reviews numbers
Lower owner earnings by roughly the cost of the role the owner stopped filling
One disclosed venue at 19.2% [3]. A single observation, not a band
Franchised
Buys an indoor playground franchise, pays royalties, follows the operating manual
Revenue support in exchange for fees that come off the top line
Franchise disclosure filings publish grouped averages, not per-unit margins
Host-site concession in a mall, school, hotel or resort
Operates inside someone else’s footfall, often on a revenue share
Lower ceiling, lower floor, and materially lower marketing spend
No disclosed transactions found. Model must be built per site
Which Profit Figure You Are Actually Looking At
Three different numbers share one word, and comparing them directly moves owner income by roughly the value of a full-time salary.
Seller’s discretionary earnings
Total owner benefit before the owner’s own pay. This is what business sale listings publish, and the right measure for owner income.
Operating profit before interest, tax, depreciation and amortisation
Company performance with the owner’s salary treated as a cost. This is what most published margin bands mean.
Net profit
What remains after debt service, tax and equipment depreciation. The smallest of the three.
One business returns 40% on the first measure and 25% on the second. Ask which measure a figure uses before you compare two venues, including the figures on this page: every margin in the table above is owner earnings before the owner’s own pay.
The Payback Period Nobody Agrees On
Published payback for the same model runs from under 12 months to more than 10 years, because the same figure gets quoted for different venue sizes on different definitions of payback.
Venues already trading change hands at 1.9 to 3.3 times annual owner earnings, which is the only figure here set by a buyer rather than a seller.
Payback Claims Across the Indoor Playground Industry
| Source type | Stated payback | Venue it applies to | Assumptions stated | Comparable |
|---|---|---|---|---|
| Equipment supplier, headline figure | 18–24 months capital recovery | 5,000 sq ft, $150,000–400,000 invested | Yes. Separates operating break-even at months 3–6 from capital recovery | Yes |
| Same supplier, admissions only | 36 months | Same venue, without parties or food | Yes | Yes |
| Equipment supplier, conservative tier | 5–8 years | 300–500 m², 1,500–3,000 monthly visits | Yes. Area, footfall, spend per visit and margin all stated | Yes |
| Same supplier, mid tier | 3–5 years | 600–1,200 m², 4,000–8,000 monthly visits | Yes | Yes |
| Same supplier, high-performing tier | 18 months to 3 years | 1,500–3,000+ m², 10,000–20,000+ monthly visits | Yes | Yes |
| Financial modelling publisher | 10+ years conservative, 4–6 years base, 2.5–4 years upside | Not stated | Partly. Scenarios are named but not sized | Limited |
| Market pricing, category median | 3.33 years (derived) | 512 entertainment and recreation businesses sold | Yes. Asking price divided by owner earnings | Yes, for a venue already trading |
| Market pricing, three disclosed venues | 1.92, 2.55 and 3.17 years (derived) | Los Angeles; 4,000 sq ft Texas, established 2023; California manager-run franchise | Yes. Asking price divided by owner earnings | Yes, for a venue already trading |
What the 18 to 24 Month Claim Assumes
Market pricing is the strongest check available, because those two rows are prices buyers and sellers agreed on. A venue that has already survived construction, licensing, fit-out and its first year of trading changes hands at 1.9 to 3.3 times annual owner earnings, so a venue you have not built yet carries all of that risk and cannot honestly recover capital faster.
Send Your Floor Plan for a QuotationThree Questions That Resolve Most of the Disagreement
Which payback is measured?
Operating break-even arrives in months 3 to 6 while capital recovery is still years away.
Which size of venue?
A conservative tier and a high-performing tier in the same published model are 5 to 8 years and 18 months apart, on the same page.
Forecast or transaction?
Forecasts are built by the party selling you the equipment. Multiples are set by the party spending the money.
Investment Structure and Delivery Timeline
Price follows floor area, structure height, the equipment you specify, the safety design basis for your market, and shipping distance, so a custom installation has no price list and your figure comes back in a written quotation. Below is where the capital goes before you open.
Where Indoor Playground Startup Capital Goes
35–45%
Play equipment and structures
Buys: The soft play structure, attractions and safety surfacing
Risk: Specifying to a photograph rather than to the floor plan
20–30%
Fit-out and building works
Buys: Flooring, lighting, ventilation, interior design, party rooms, cafe
Risk: Discovering the ceiling height after the structure is designed
10–15%
Lease deposit & landlord works
Buys: Deposit, fire and access compliance, tenant improvements
Risk: Signing a lease before the permit path is confirmed
8–12%
Working capital, three months
Buys: Rent, payroll and marketing before revenue stabilizes
Risk: The failure cause operators cite most often
5–8%
Technology systems
Buys: Point of sale, booking, membership and access control
Risk: Buying a till instead of a booking system
3–5%
Safety design and inspection
Buys: Design review, local health and safety inspection, insurance-driven changes
Risk: Treating this as paperwork rather than as a design input
Operating Costs That Start the Day You Open
These four lines are what the payback tables above are recovering against, and they run whether or not anyone walks in.
Rent:
Fixed from day one, and the item most often over-committed against optimistic foot traffic.
Payroll:
Scales with supervised zones and opening hours, not with revenue.
Utilities:
Heating, cooling and lighting a high-ceiling hall costs materially more than a retail unit of the same floor area.
Insurance and cleaning:
Insurance costs are priced against children’s activity risk, and both lines rise with footfall.
Why Two Similar Play Sets Can Differ Fivefold
Buyers report near-identical foam obstacle sets priced at $900 and at $150, and play equipment is 35 to 45% of startup capital, so that gap sets the budget. Four things account for almost all of it:
01
Safety design basis:
Commercial indoor playground equipment is designed against published geometry rules for head, neck, finger and clothing entrapment. Consumer-grade equipment is not.
02
Materials and construction:
Padding density, seam construction and laminate specification are set for years of daily unsupervised impact rather than for a photograph.
03
Documentation:
Structural drawings, hardware lists and installation instructions are what a local inspector and an underwriter ask to see.
04
Service life and cleanability:
Torn padding, weak seams and hard-to-clean corners appear after opening, when replacement costs more than the original saving.
Our products can be designed according to relevant EN and ASTM safety requirements, depending on product type and target market, and the acceptance path in your jurisdiction stays with your local authority, your landlord and your insurer. Samples and pre-production prototypes are available; sample charges and freight are stated in your quotation.
Project Stage & Delivery Timeline
Order confirmation to arrival
45–95 days
The production window is confirmed with your quotation once the layout is approved
Design and layout approval
Runs alongside your permit work
Space planning, floor plan, 3D design and revisions
Production, small batch
25–45 days after design approval
Manufacturing and quality control, with freight quoted separately
Production, full project
30–60 working days after design & deposit
Full structure, attractions and ancillary items
International shipping
15–35 days
Port to port, subject to routing and customs
Payment is a deposit with the order and the balance settled before dispatch, by telegraphic transfer. We ship EXW and FOB; cost-and-freight and delivered-duty-paid terms are quoted on request. Freight, duties and local installation labour sit outside the equipment quotation and should be budgeted separately.
The Difference Between Profitable Indoor Playgrounds and the Rest
A manager who ran five family entertainment centers over six years reported that none performed well, and named the same five causes each time: floor area beyond what the catchment supports, opening hours set by habit, a site with no passing traffic, cheap staffing, and parties run on the open play floor. None of the five is about the equipment.
Failure mode
Renting more space than the catchment supports
Opening hours set by habit
A site with no visibility or passing traffic
Staff who are cheap rather than engaged
Birthday parties treated as an add-on
What it looks like
Rent scales with area from month one while footfall does not
Staffed hours no parent uses, empty weekday mornings, closing before evening parties
You market for every single visit, and competition for the same families raises what that advertising costs
Slow cleaning, unsupervised zones, parties that run late, no repeat visit
Parties run on the open play floor, capping both lines at once
What fixes it, and when
Size the floor to the catchment arithmetic before the equipment quotation, not after
Set hours from booking data and school schedules, and sell the empty hours to groups
Impulse-led venues need foot traffic past the door; booking-led venues can trade it for cheaper rent
Hire for working with children and budget supervision as a revenue line. The most reversible item on this list
Design dedicated party rooms into the floor plan before the structure is laid out
A Profitable Indoor Play Area Competes on Supervision, Not Floor Area
One operator described a competitor three times the size opening 0.3 miles away, and reported negligible loss of customers because the larger venue staffed the floor with disengaged teenagers. Supervision quality, not floor area, drives the second visit.
“We ask for the floor plan before we ask what attractions you want. Sightlines from the cafe to the play structure decide how many staff you need on the floor, and that number stays in your cost base for the life of the venue.”
— Dreamland Playground Engineering Team
Key Insight
None of the five is fixed by marketing efforts. One owner two months into trading reported revenue at roughly twice expenses, on a site that passed the catchment test first.
From Floor Plan to Opening Day
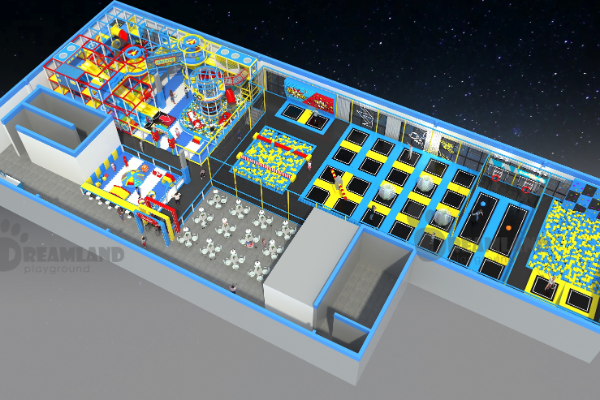
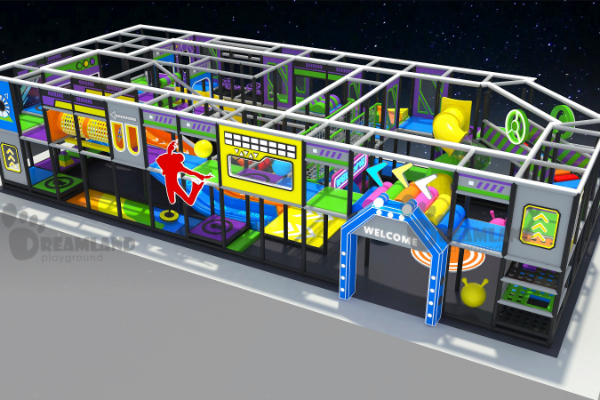
We work from your floor plan and site dimensions, and our design team produces the space planning and 3D design. The scope runs from space planning, floor plan, 3D design, production, shipping, installation support and after-sales service. What comes back first is a zoned layout and a quotation priced line by line, before any deposit.
1
SITE INFORMATION
Send your site information: floor area, ceiling height, column positions, access routes, and the age groups and attractions you want to serve.
2
LAYOUT & 3D DESIGN
Layout and 3D design, returned as a space plan showing zoning, circulation, supervision sightlines and party room placement.
3
WRITTEN QUOTATION
Written quotation, priced line by line so you see what each zone costs before you commit.
4
PRODUCTION & INSPECTION
Production and inspection run to the approved drawings, with your production window confirmed in the quotation.
5
SHIPPING & INSTALLATION
Shipping and installation support. If a component does not match the approved drawings, we replace it and we carry that cost.
6
AFTER-SALES SERVICE
After-sales service: spare parts, replacement components and layout changes as your revenue mix develops.
What to Send, and Why Each Item Changes the Design
Design input
Why it matters
What happens without it
Floor plan with dimensions
Sets the structure envelope and circulation
Layout is drawn to an assumption and changes after quotation
Ceiling height and obstructions
Decides platform levels and slide types
Multi-level zones get cut late, taking capacity with them
The different age groups you will serve
Drives zoning, equipment scale and supervision ratios
Toddler and older-child zones collide and both underperform
Target market
Sets the safety design basis we work to
Design basis is chosen late, when changes are expensive
Revenue mix you intend to run
Positions cafe, party rooms and retail on the plan
The highest-margin lines end up with no space
Membership and Recurring Revenue in Soft Play Venues
Suppliers report memberships at 8 to 15% of revenue with better margins than admissions. A commercial loan officer who financed two soft play venues reported that both failed, and attributed it to a membership model that did not cover its costs.
The Arithmetic, So You Can Run It On Your Own Numbers
| Visits per child per year | Paid at $12 per visit | Break-even monthly membership | What a membership does here |
|---|---|---|---|
| 2 | $24 | $2.00 | No viable price exists. Sell packs of visits instead |
| 6 | $72 | $6.00 | Marginal. Only works with food and retail attached |
| 12 | $144 | $12.00 | Works if the member also spends in the cafe |
| 24 | $288 | $24.00 | Strong. The member visits on quiet weekdays |
| 36 | $432 | $36.00 | Strong, and capacity becomes the constraint |
The break-even column is admission revenue given up, before any secondary spend. A member who visits twice as often buys roughly twice as much food, which is where the model earns back what the discount costs you.
When an Indoor Playground Is the Wrong Investment
Five situations make an indoor playground the wrong use of the capital, and each was reported by owners running real venues rather than inferred. Rent above roughly a fifth of realistic revenue, and a catchment that fails the age-and-income filter, are the two that no operating skill reverses. Each has an alternative in the last column.
What makes indoor playgrounds profitable is mostly settled before anyone is operating an indoor playground at all, which is why the feasibility arithmetic on a play area business is the cheapest part of this project. On these five sites no amount of operating skill changes the answer.
Signals to Check Before You Open an Indoor Playground
| Situation | Why it works against you | What to do instead |
|---|---|---|
| Catchment too small once you filter by age and income | Footfall is capped by demographics, and no amount of marketing raises the ceiling | Run the catchment arithmetic first. Consider a smaller footprint inside an existing venue |
| Rent above roughly a fifth of realistic revenue | Fixed cost from day one against seasonal, weather-dependent income | Negotiate a turnover-linked lease, or take a host-site concession in a mall, school or hotel |
| No weekday demand | Five days of staffed, heated, empty floor space subsidised by two days of trading | Secure nursery, school or community bookings before signing, or plan reduced weekday hours |
| No food service or retail experience in the team | The highest-margin lines are the ones you are least equipped to run | Hire or franchise the cafe, or lease the food operation to an operator who knows it |
| Insurance quoted before the model is tested | Cover for children's activity risk is expensive and is quoted after equipment inspection | Get an indicative quotation early, and treat inspection requirements as a design input |
Indoor Playground Profitability Tools
Access our analytical toolkits designed for commercial playground operators and investors to evaluate revenue catchments, optimize membership pricing, and calculate project break-even points.